General stats (feed types)
General statistics of nutrient/metabolite concentrations in feed types
About this page
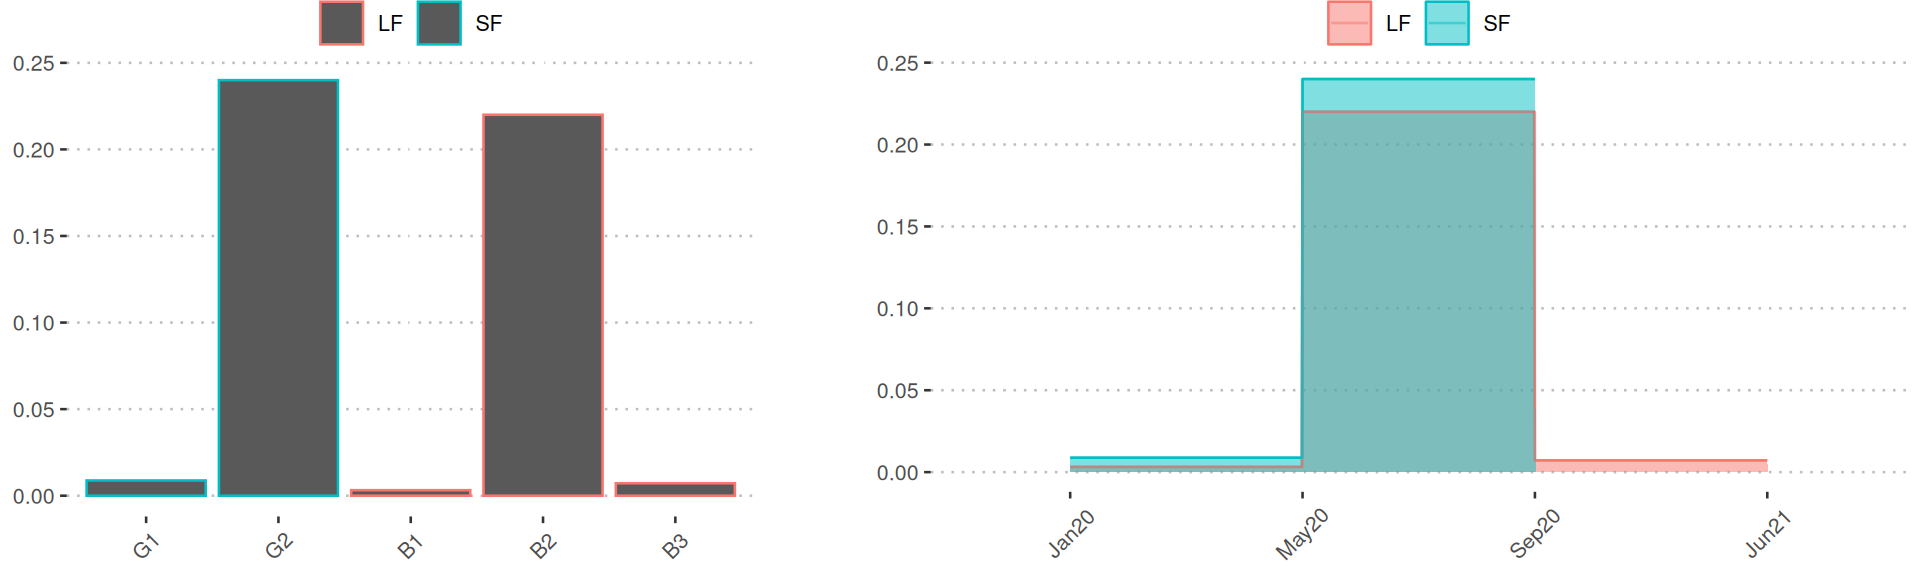
This page exhibits concentrations of various nutrients and metabolite in feed, separated into the following categories.
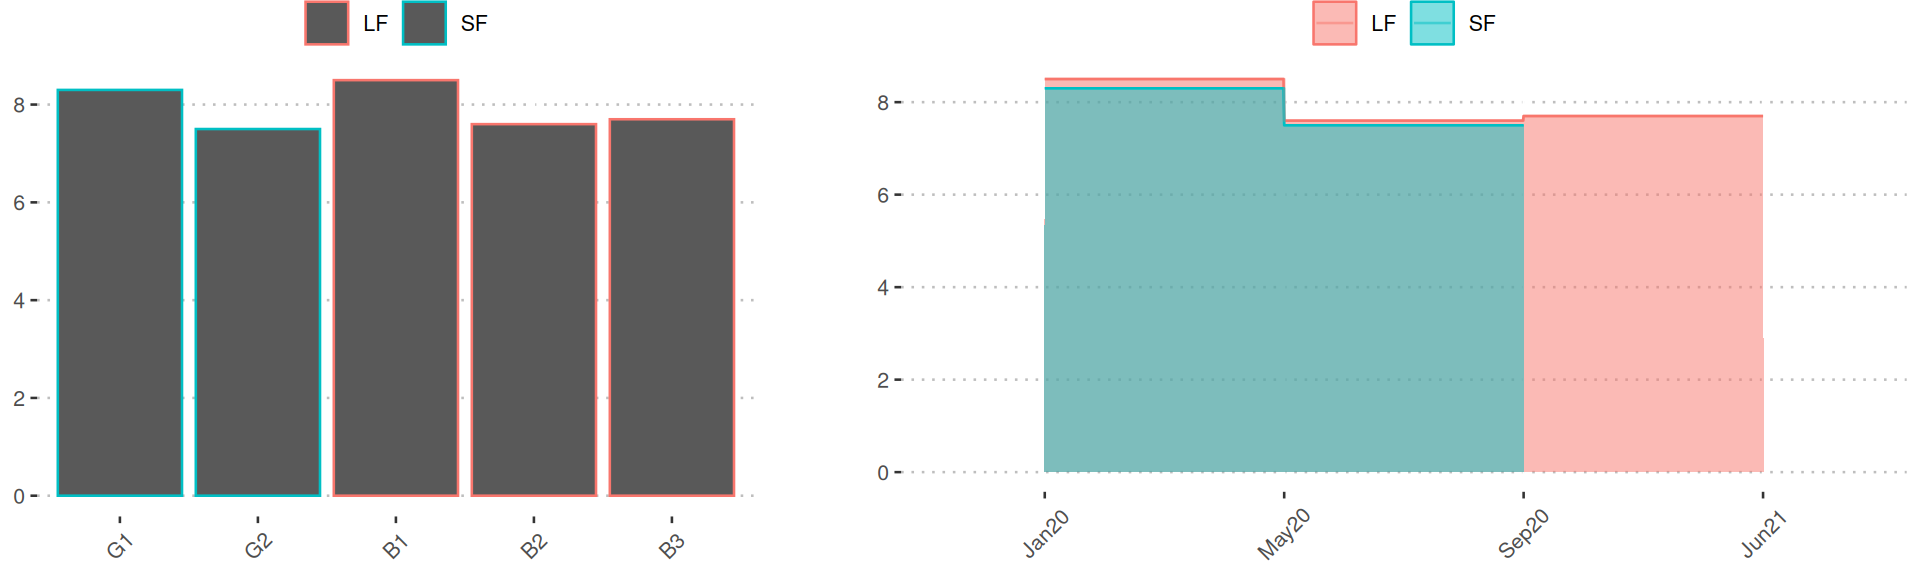
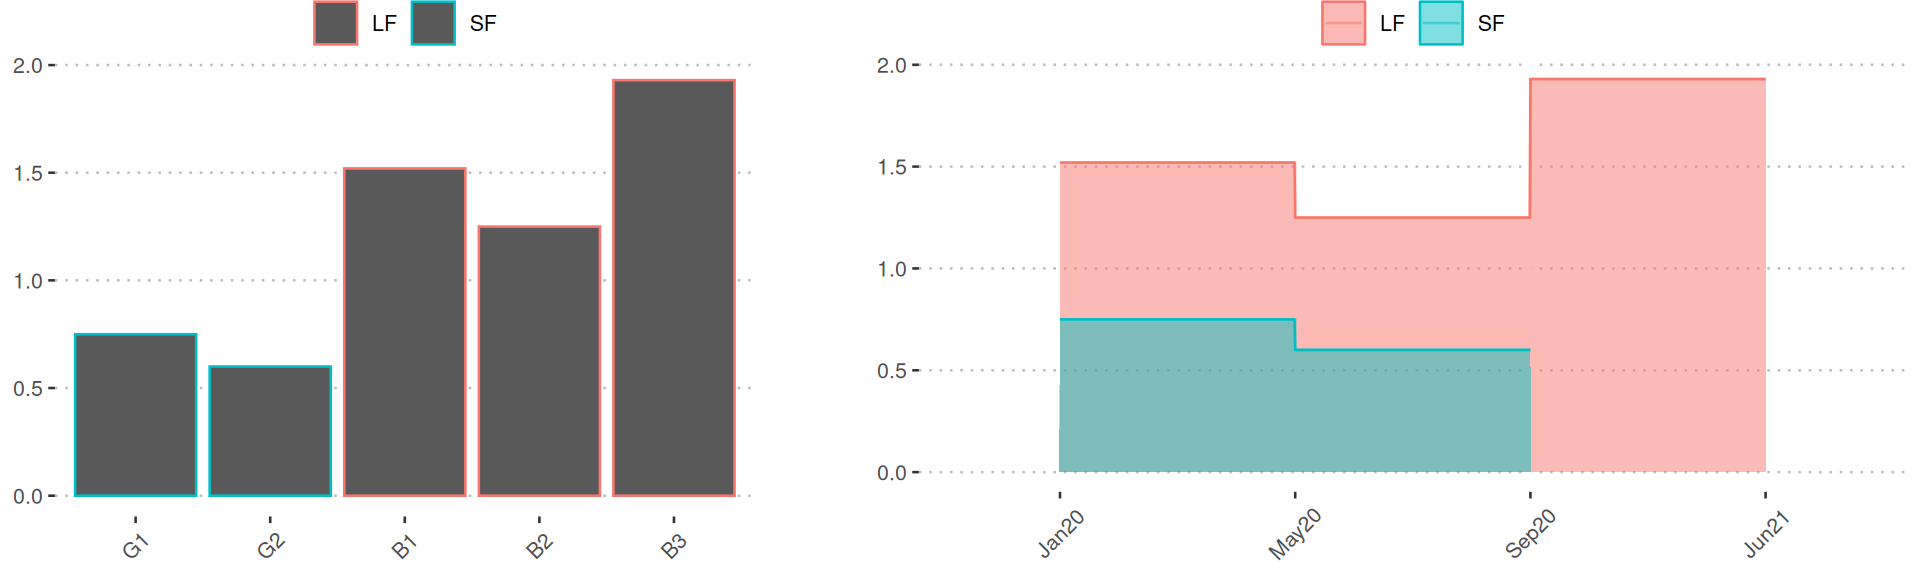
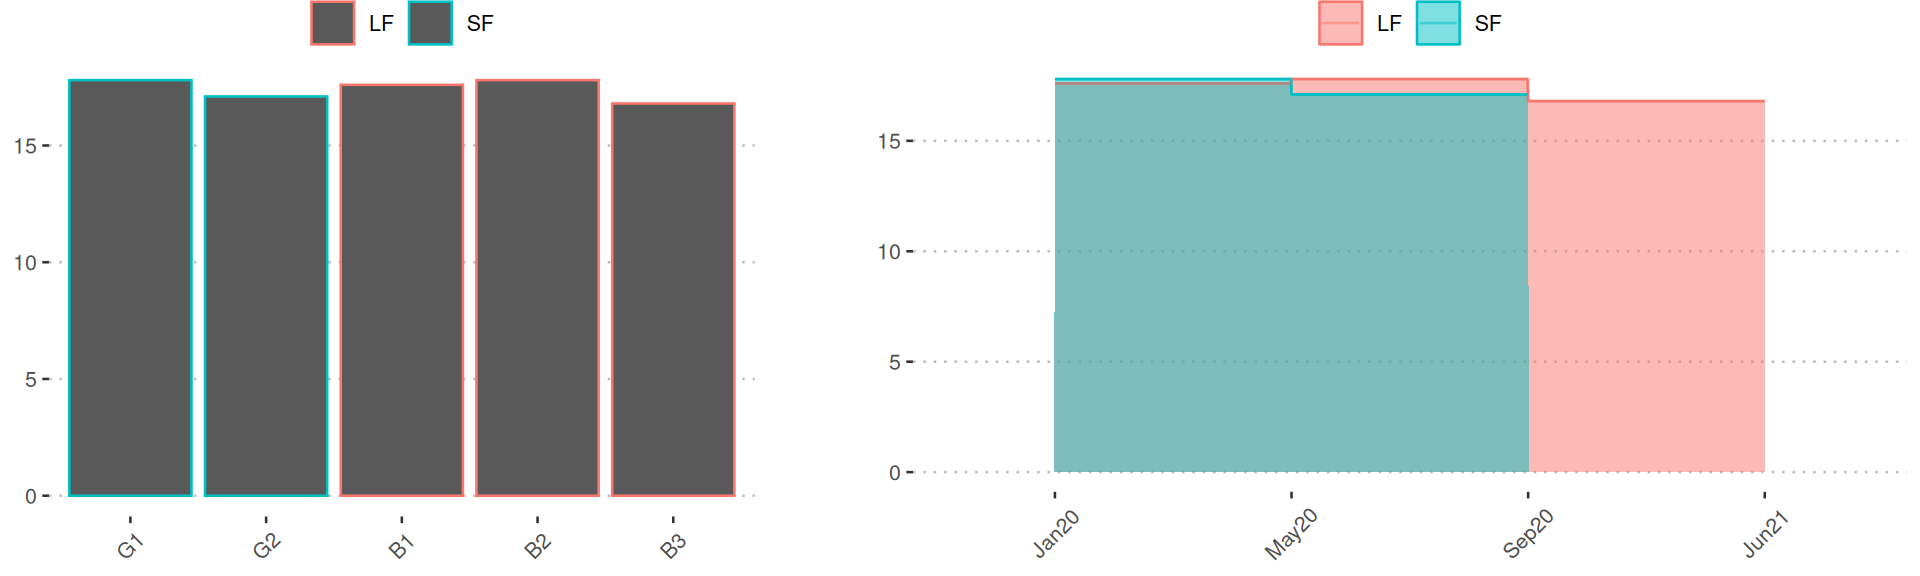
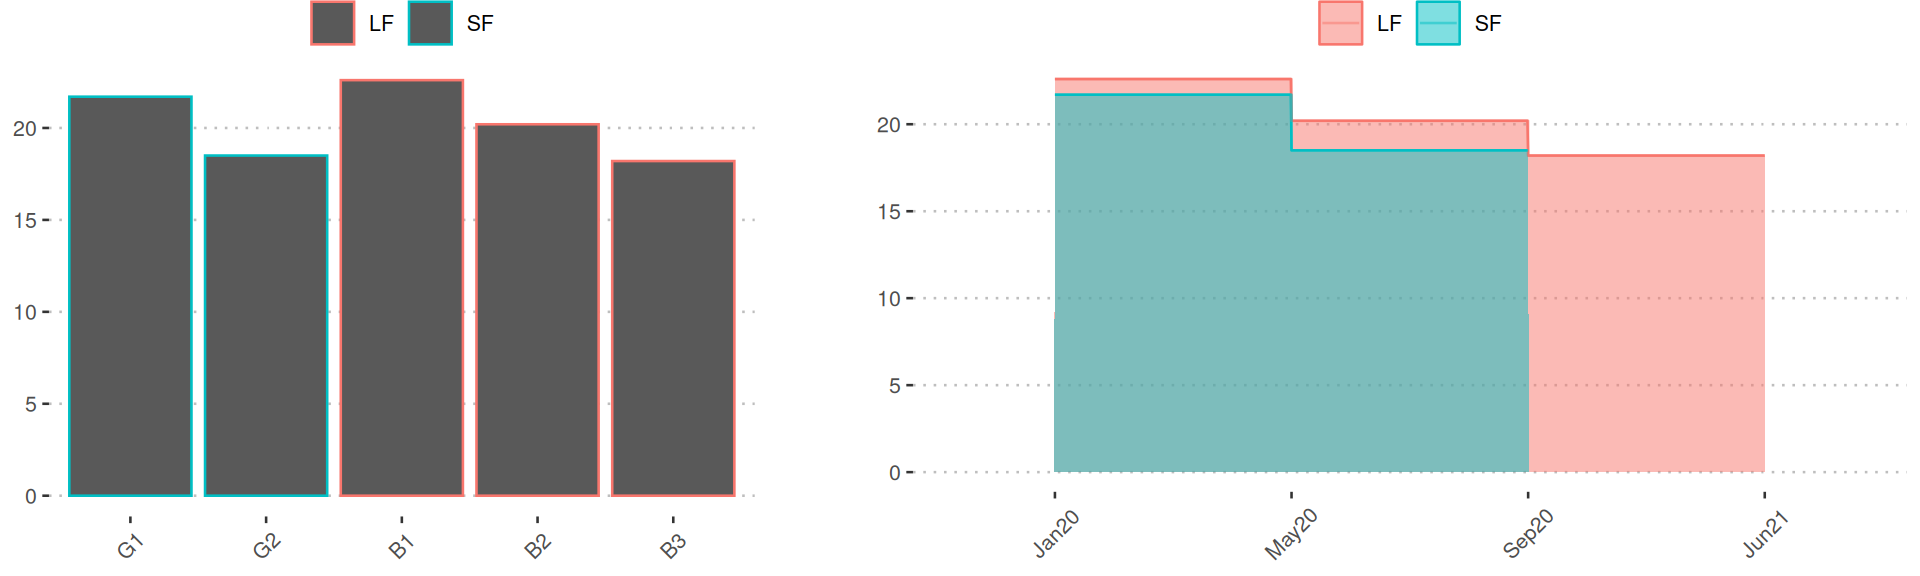
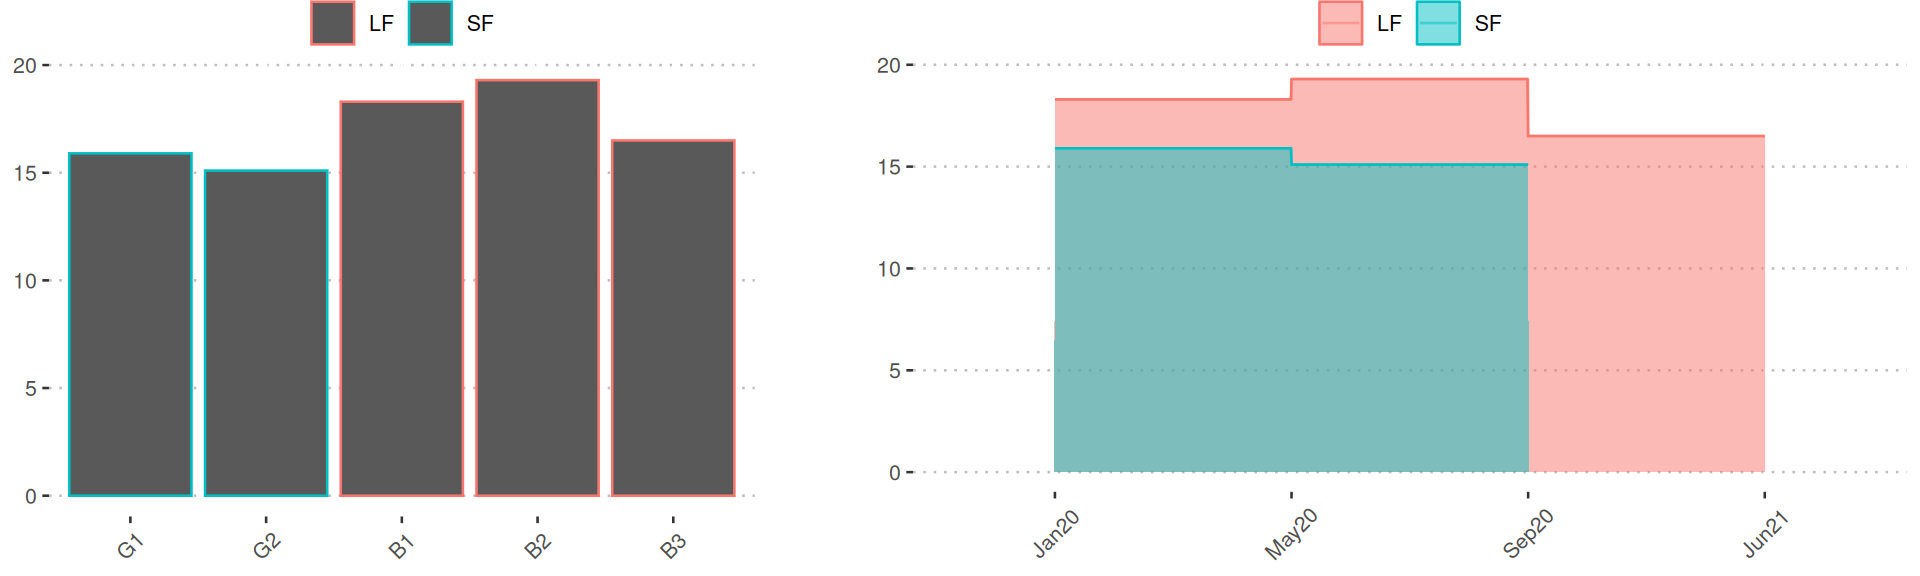
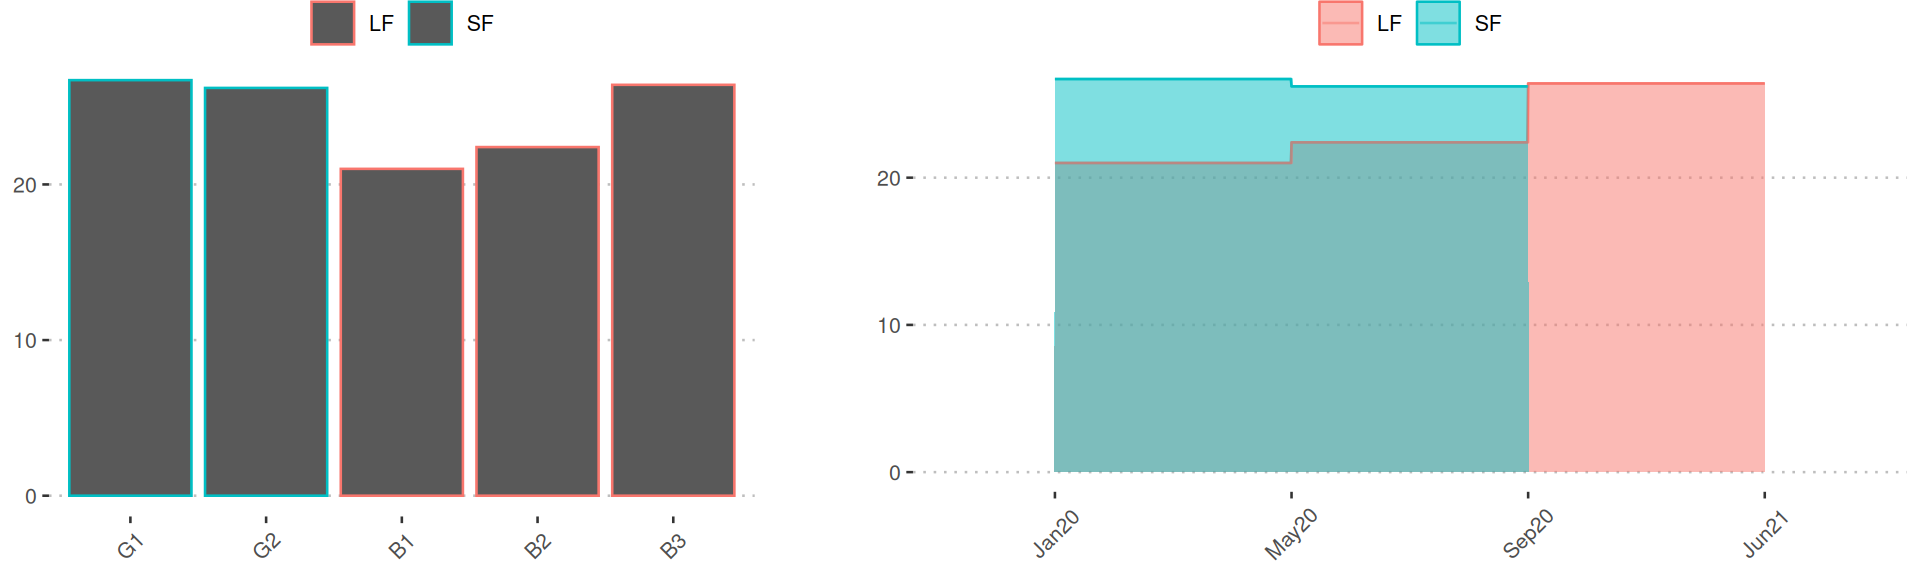
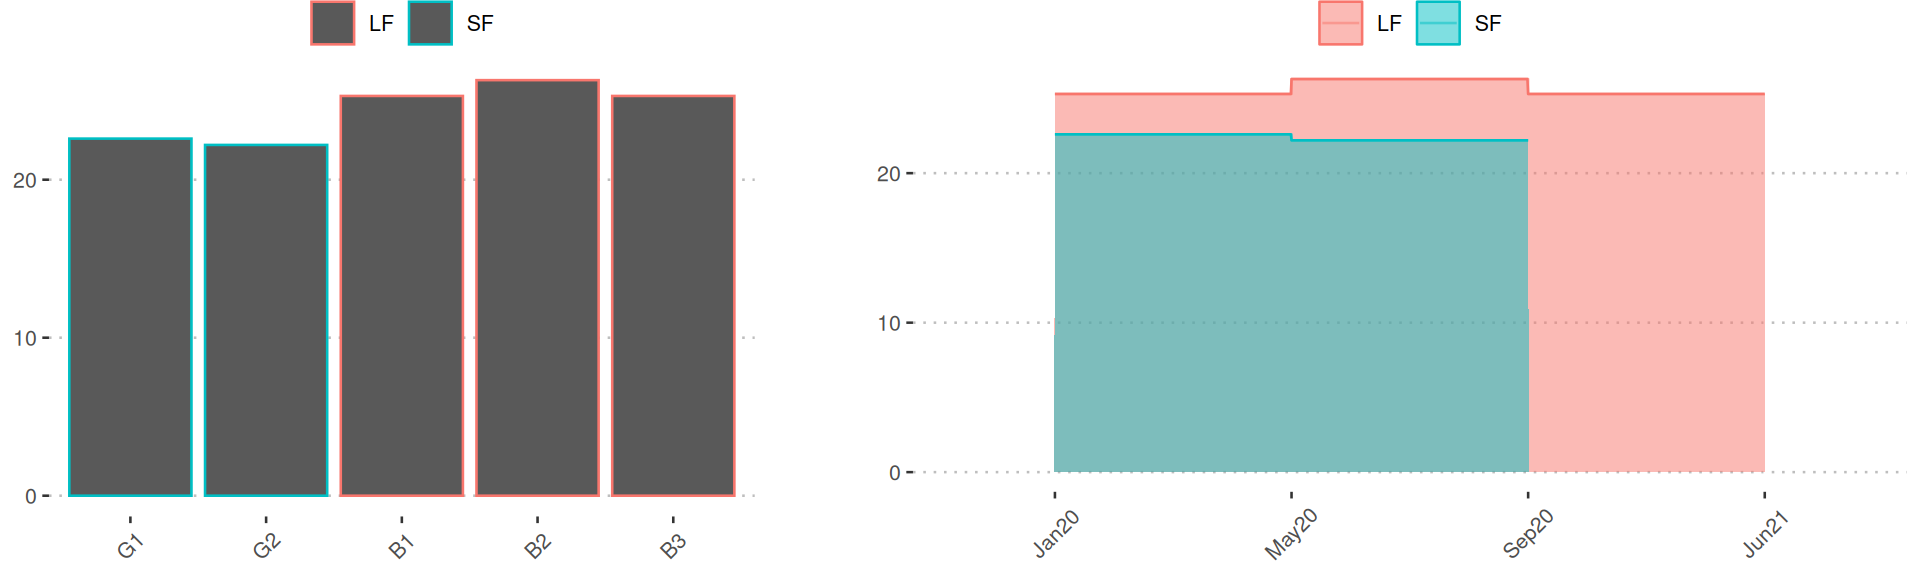
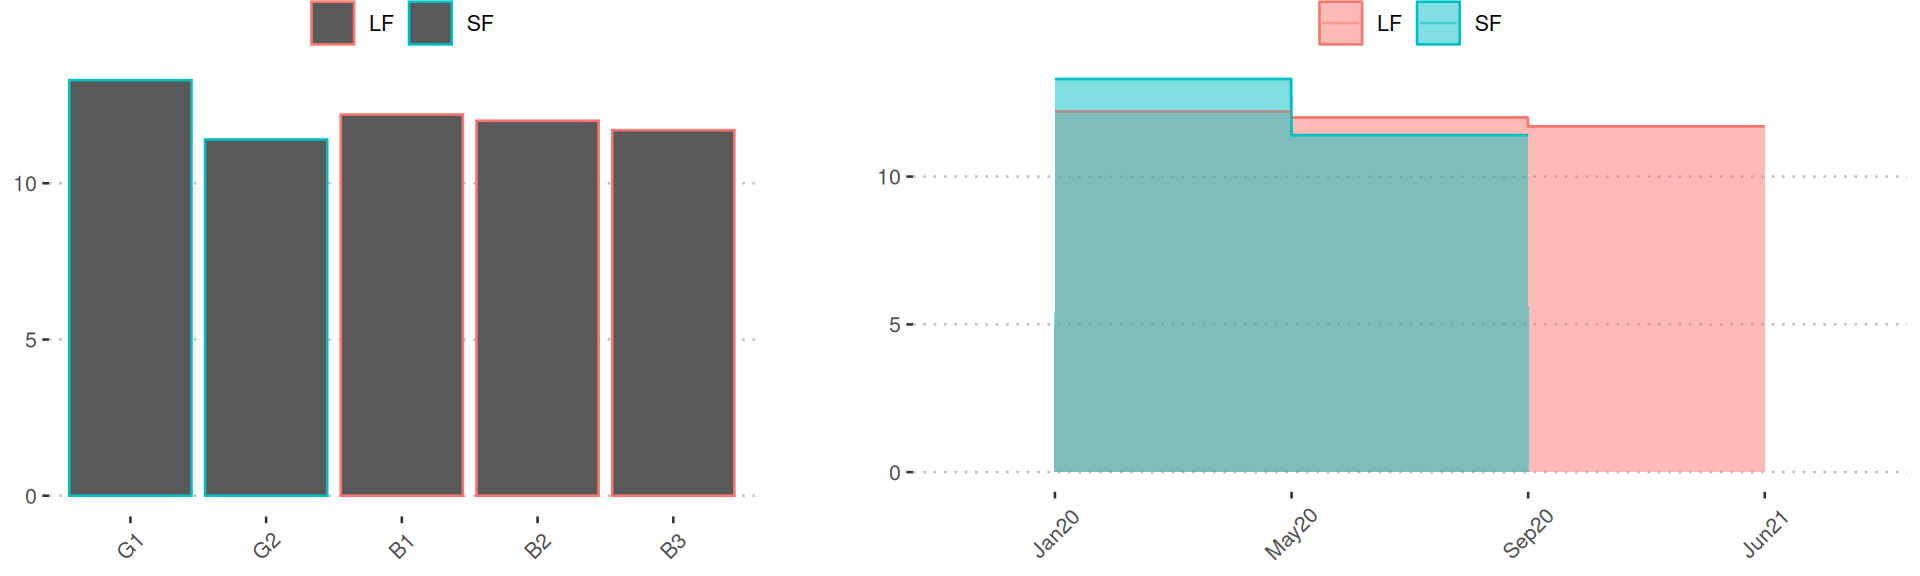
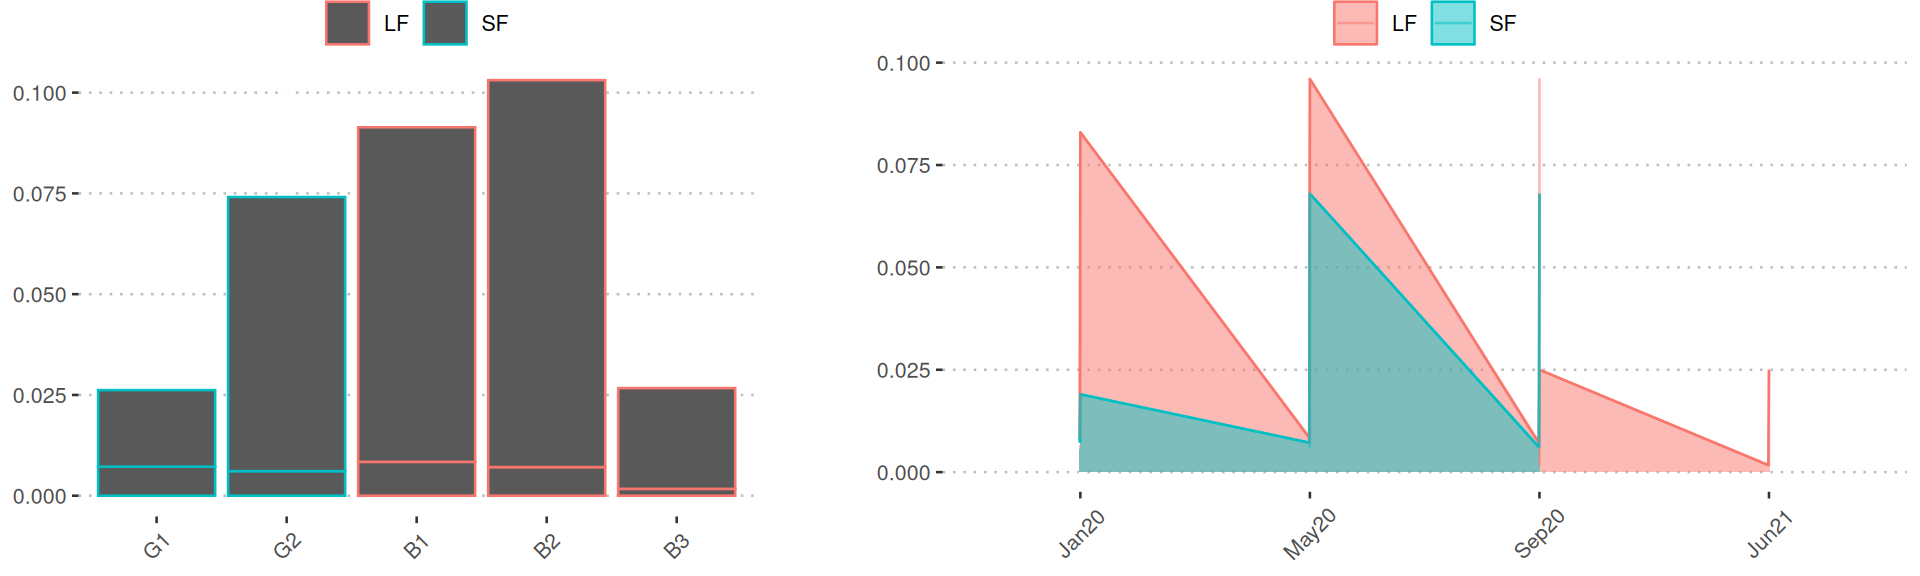
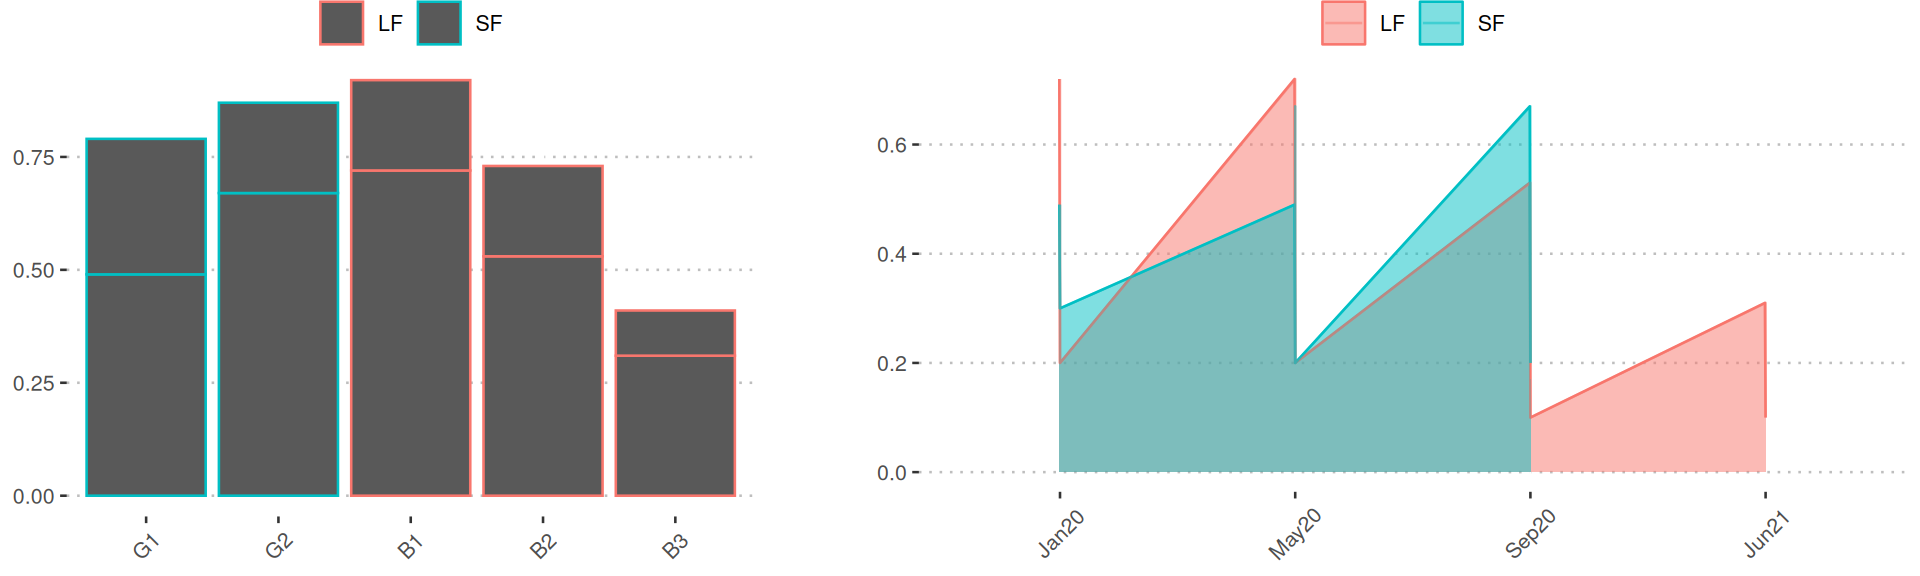
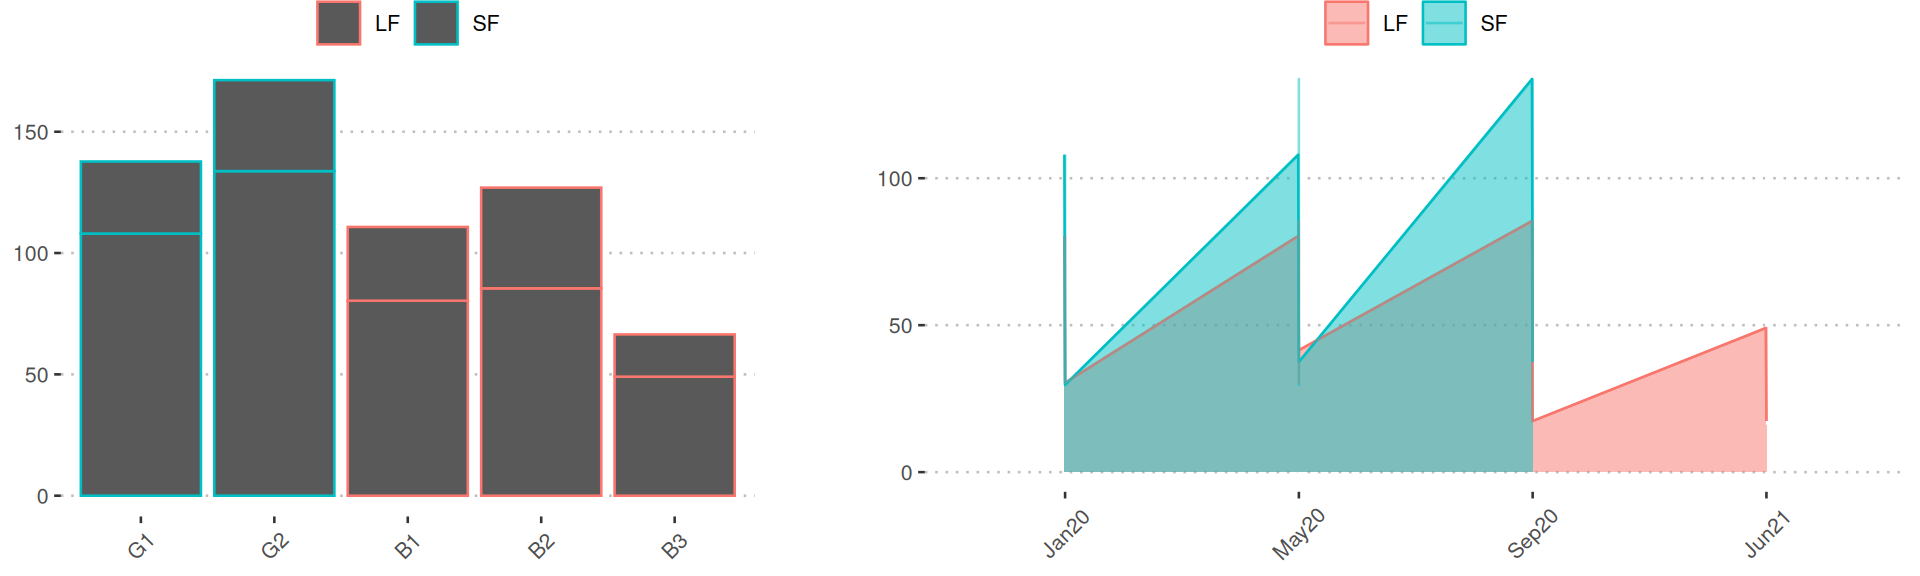
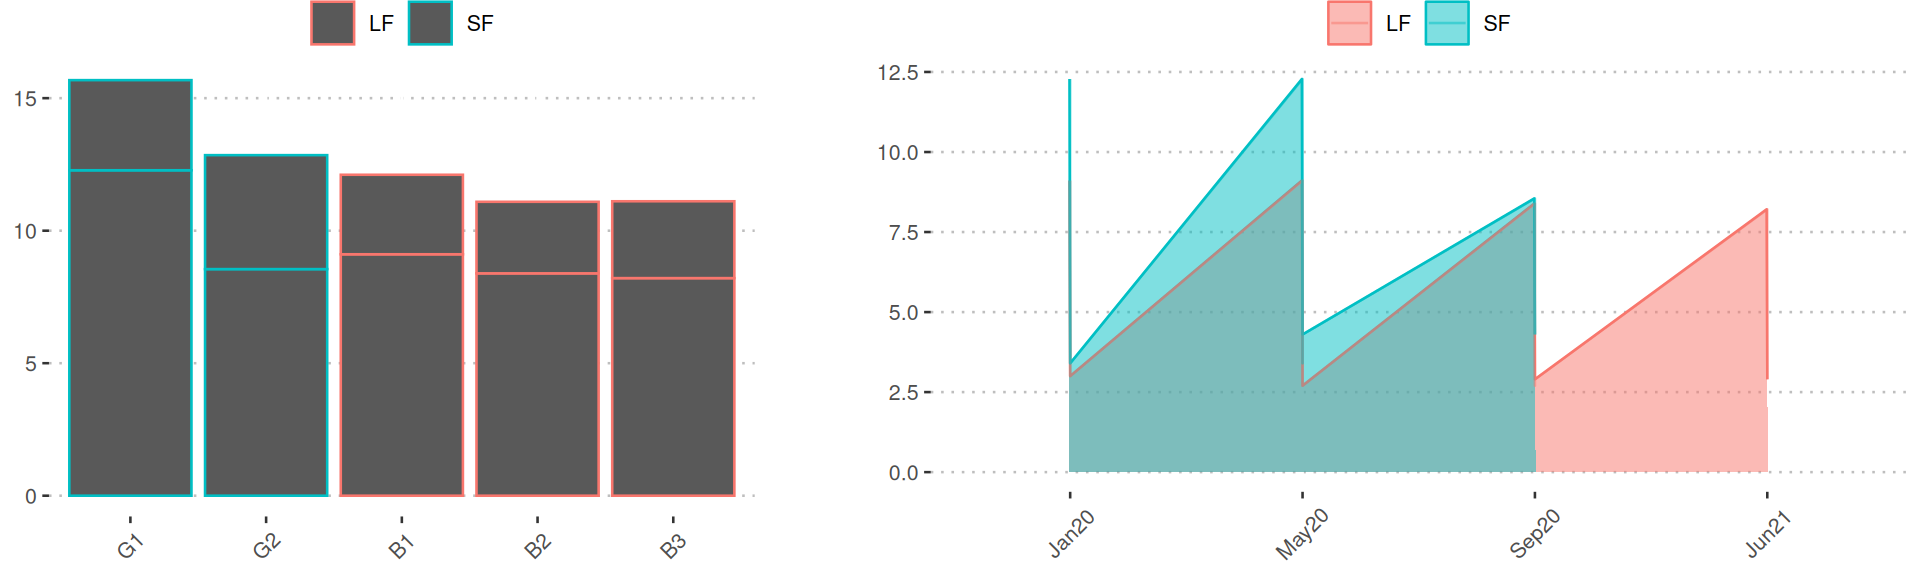
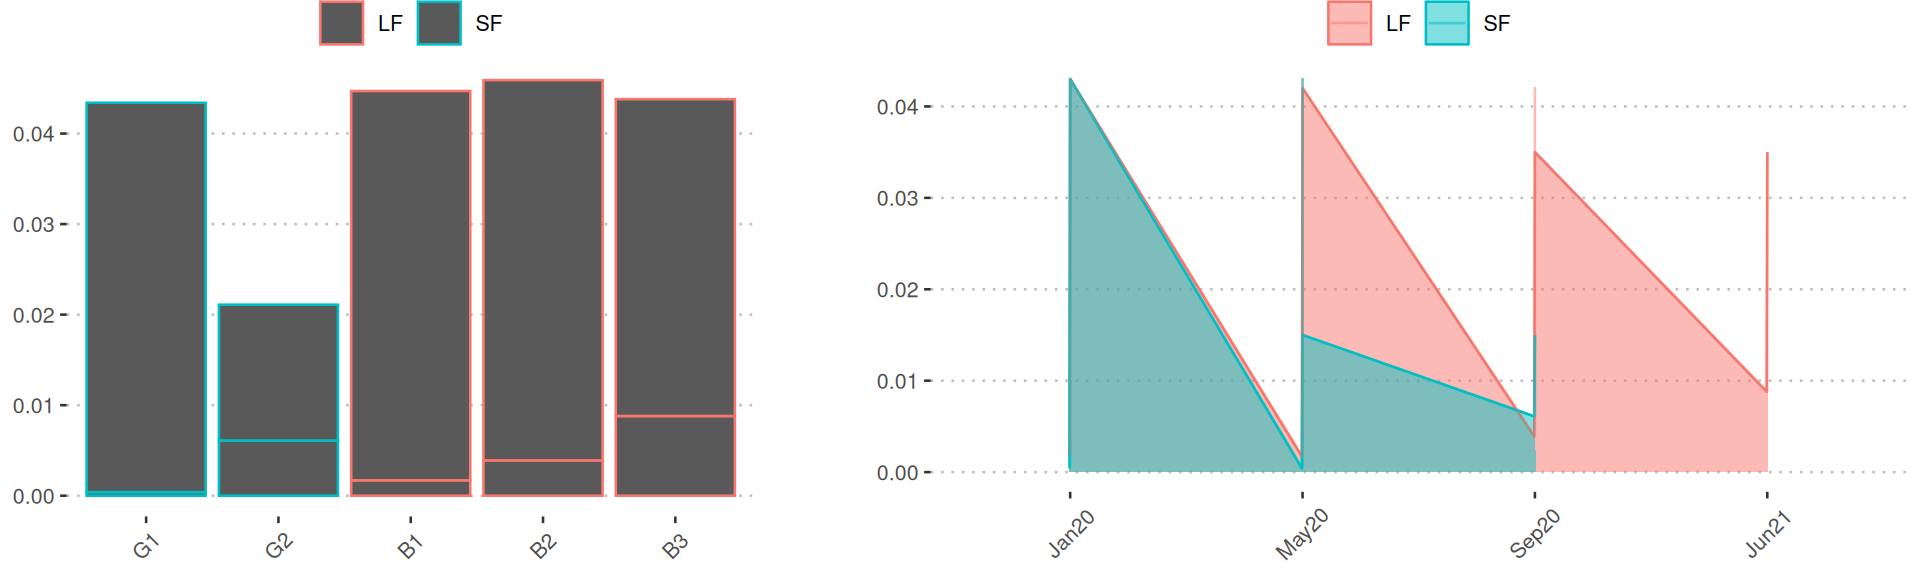
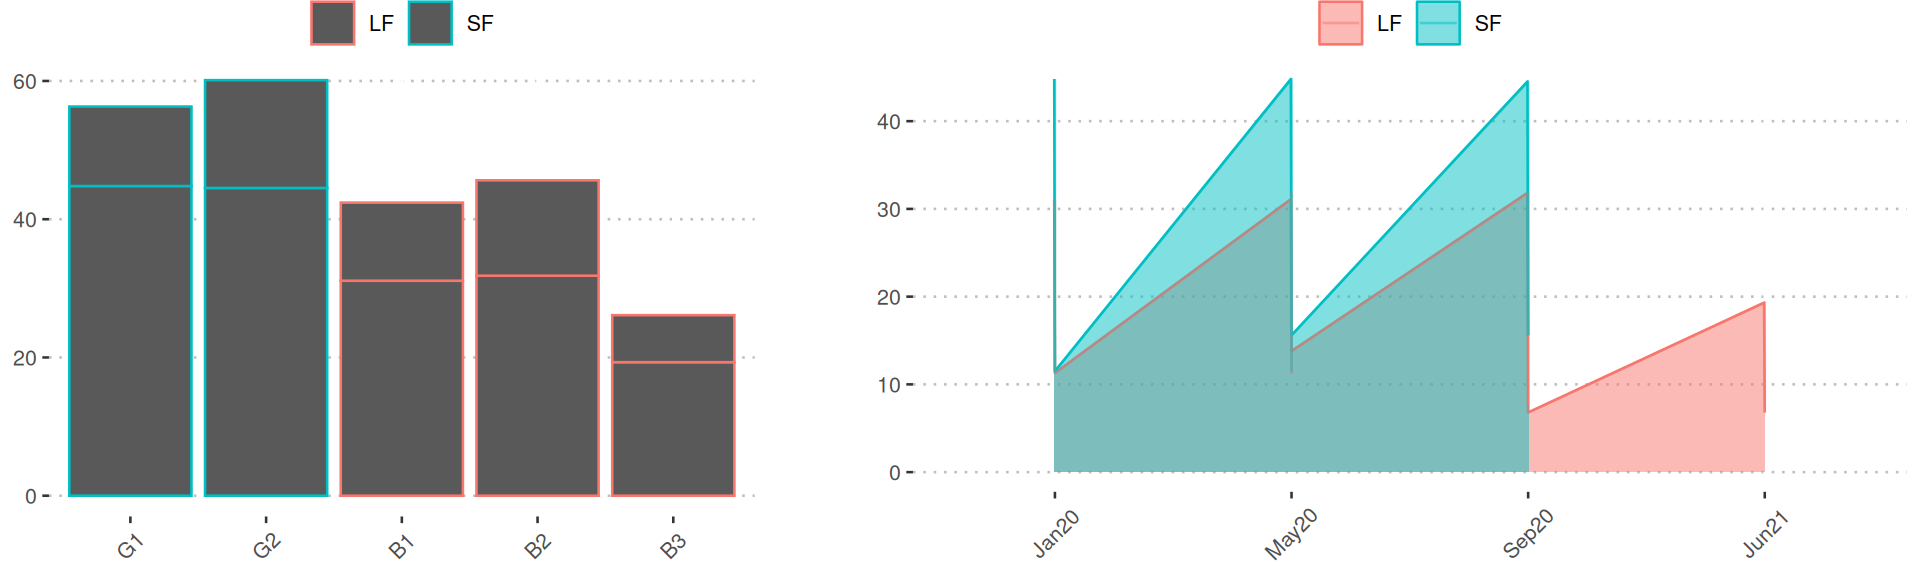
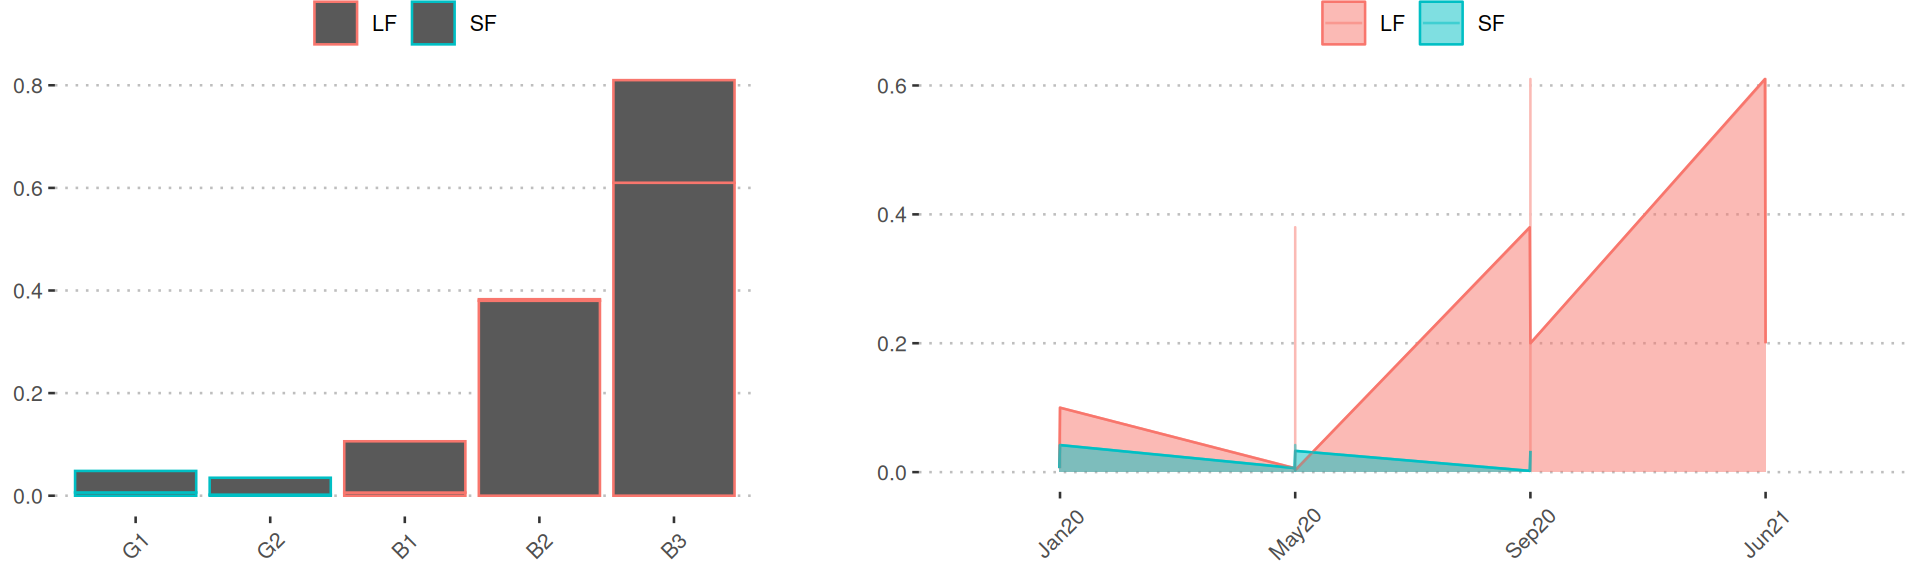
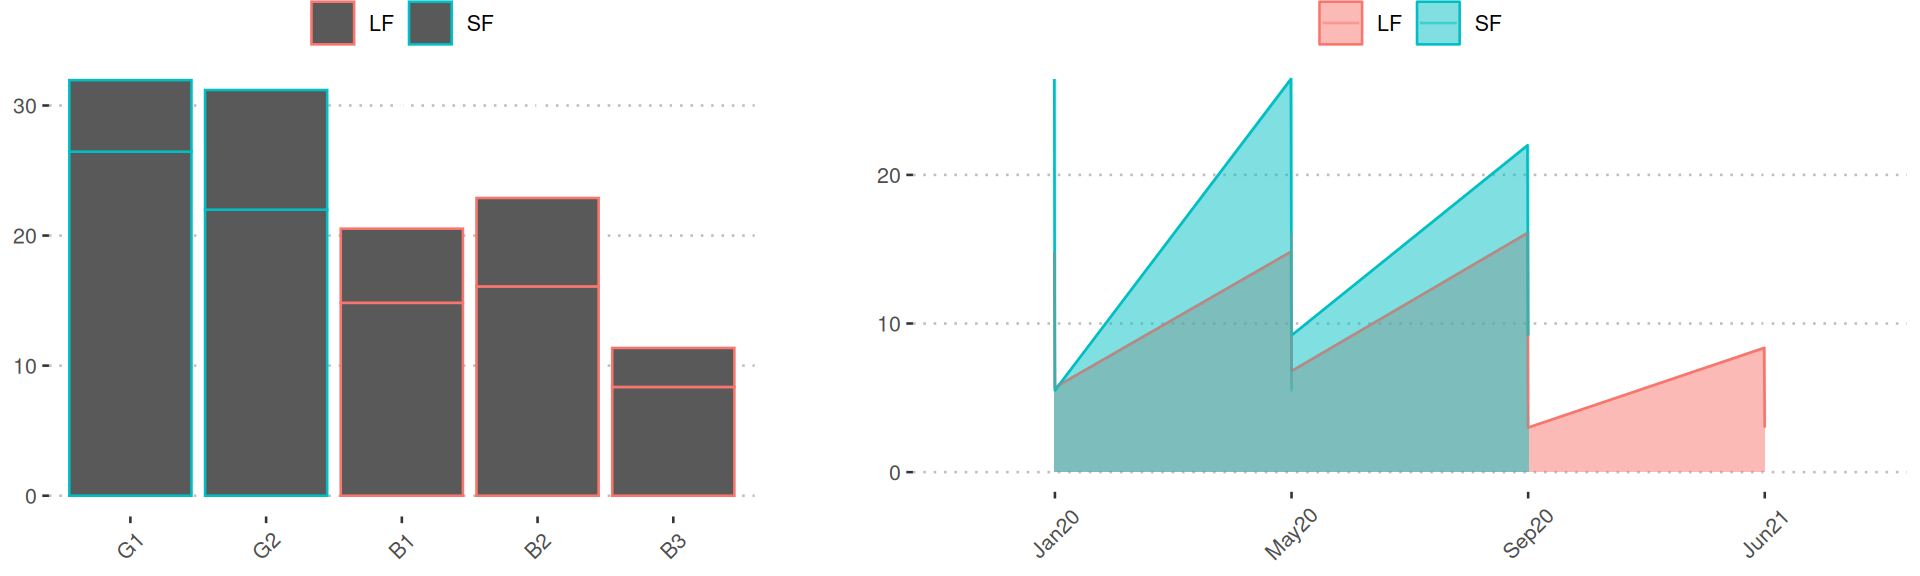
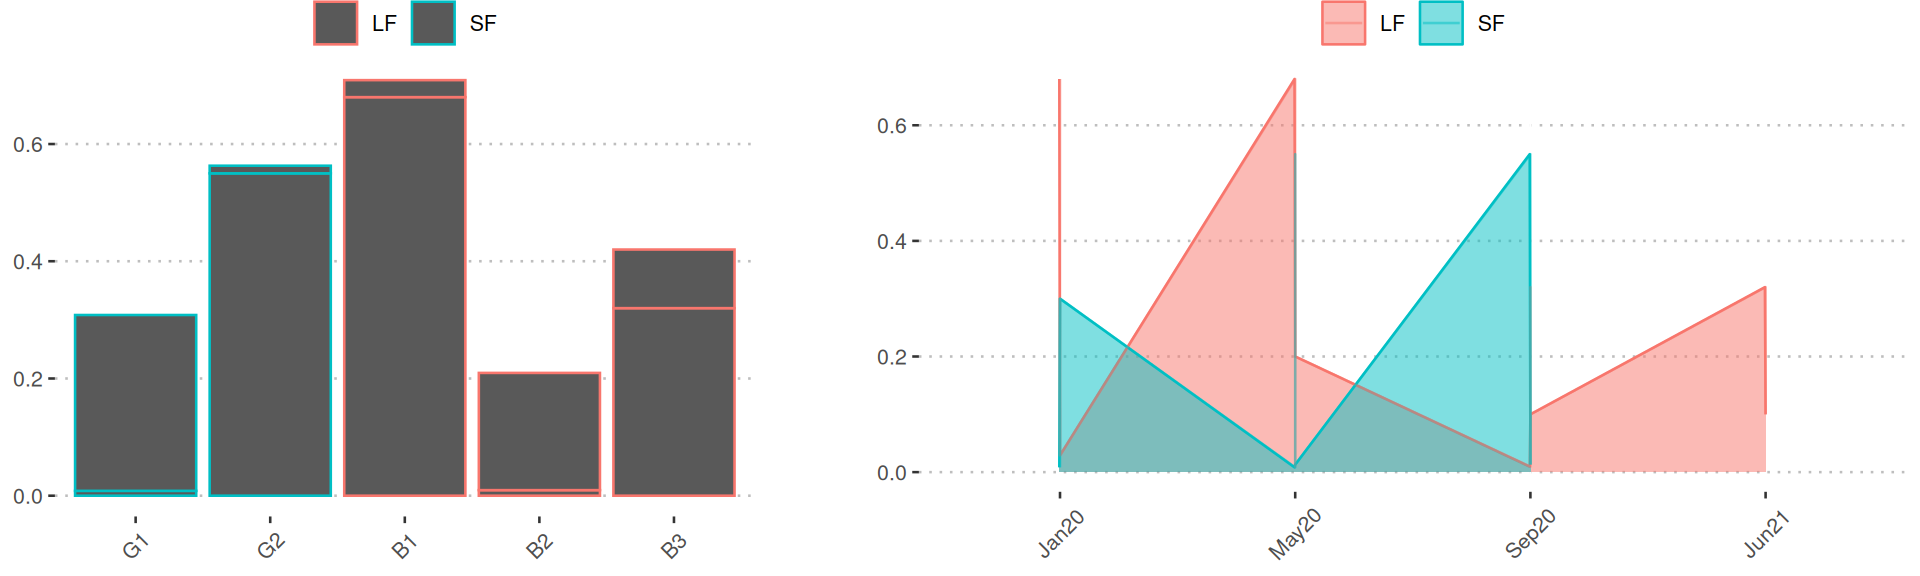
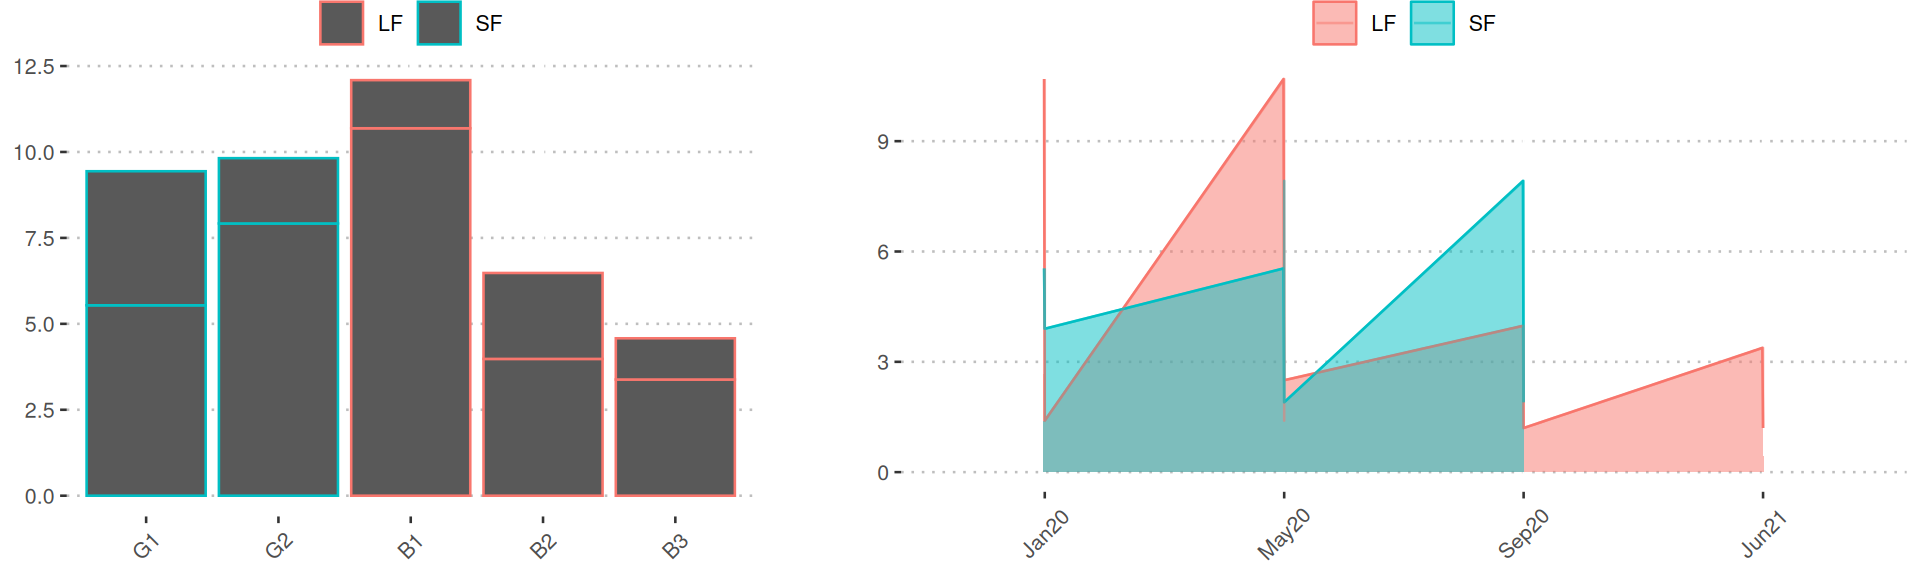
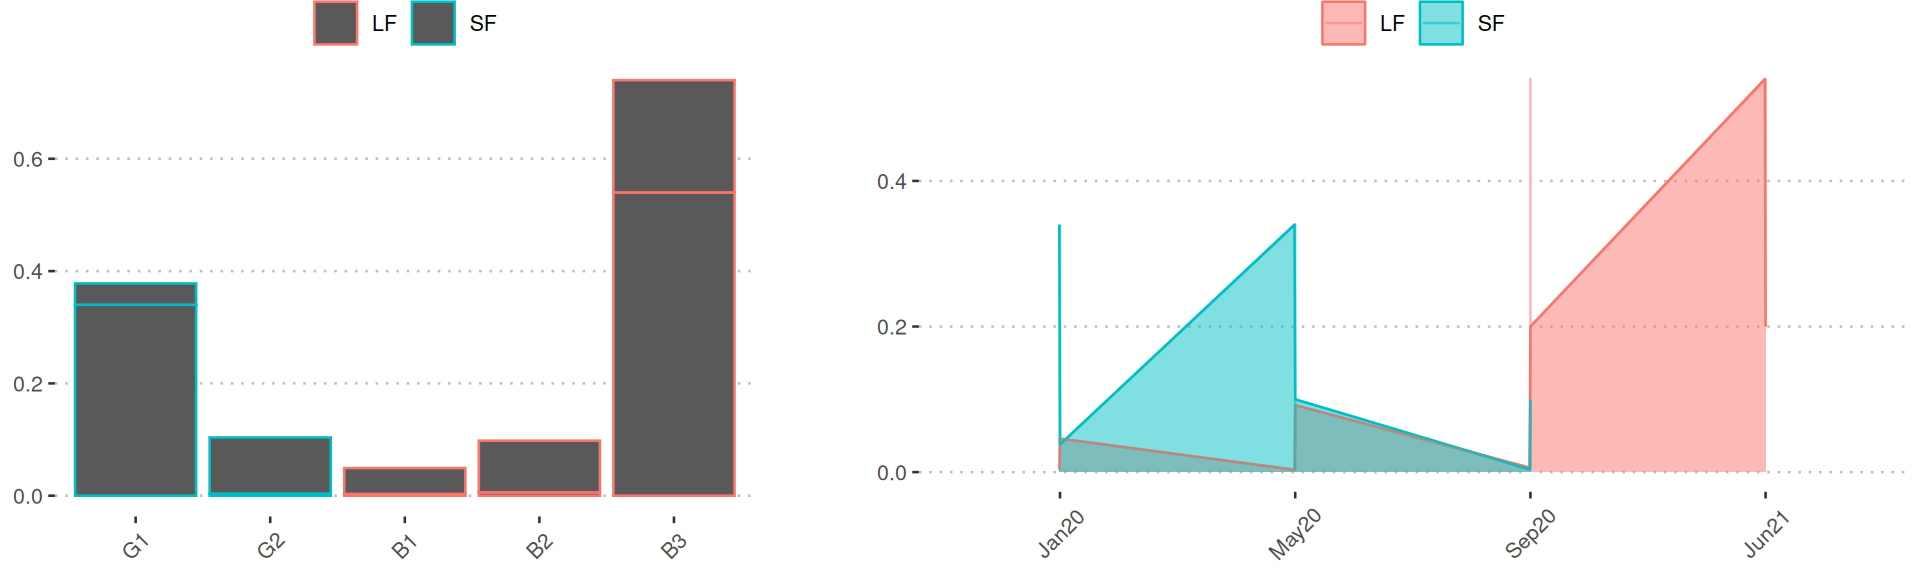
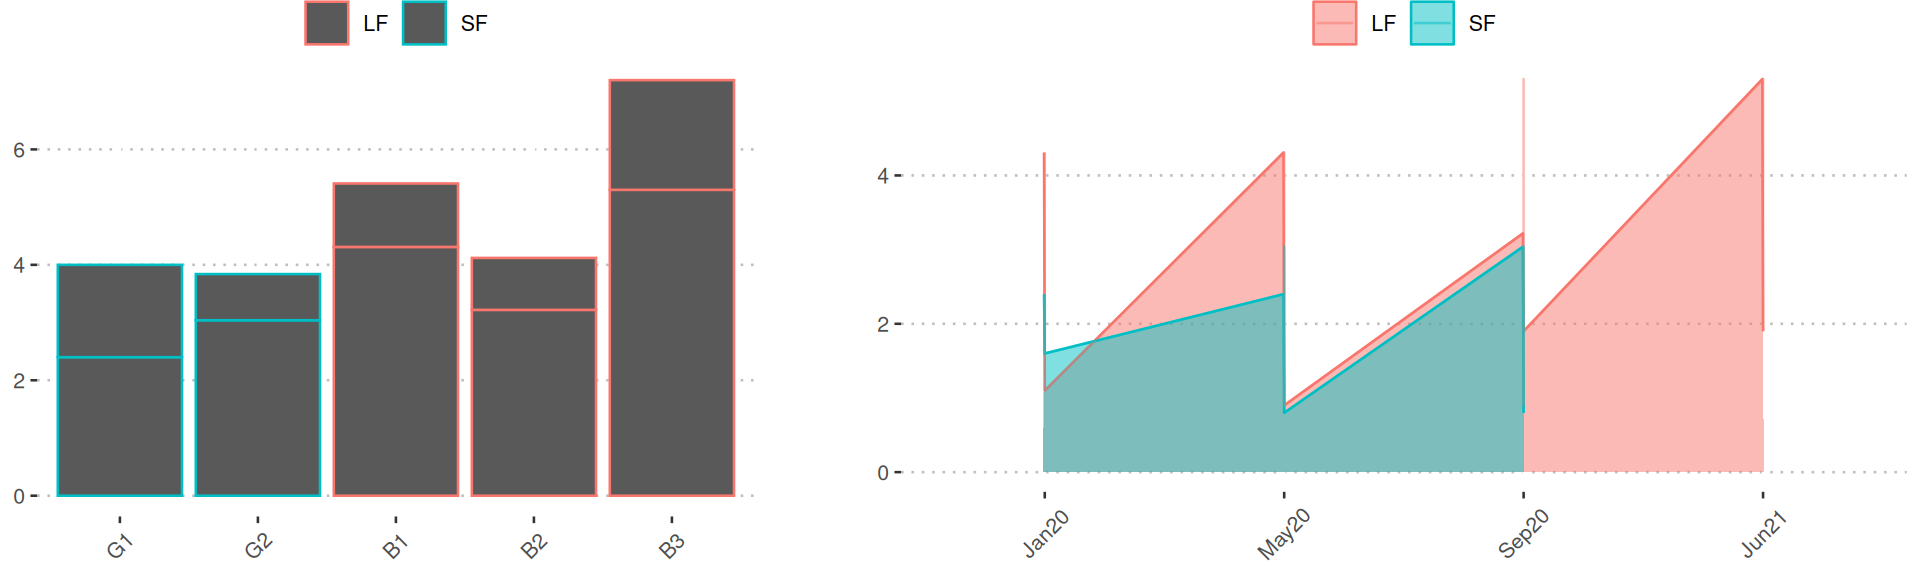
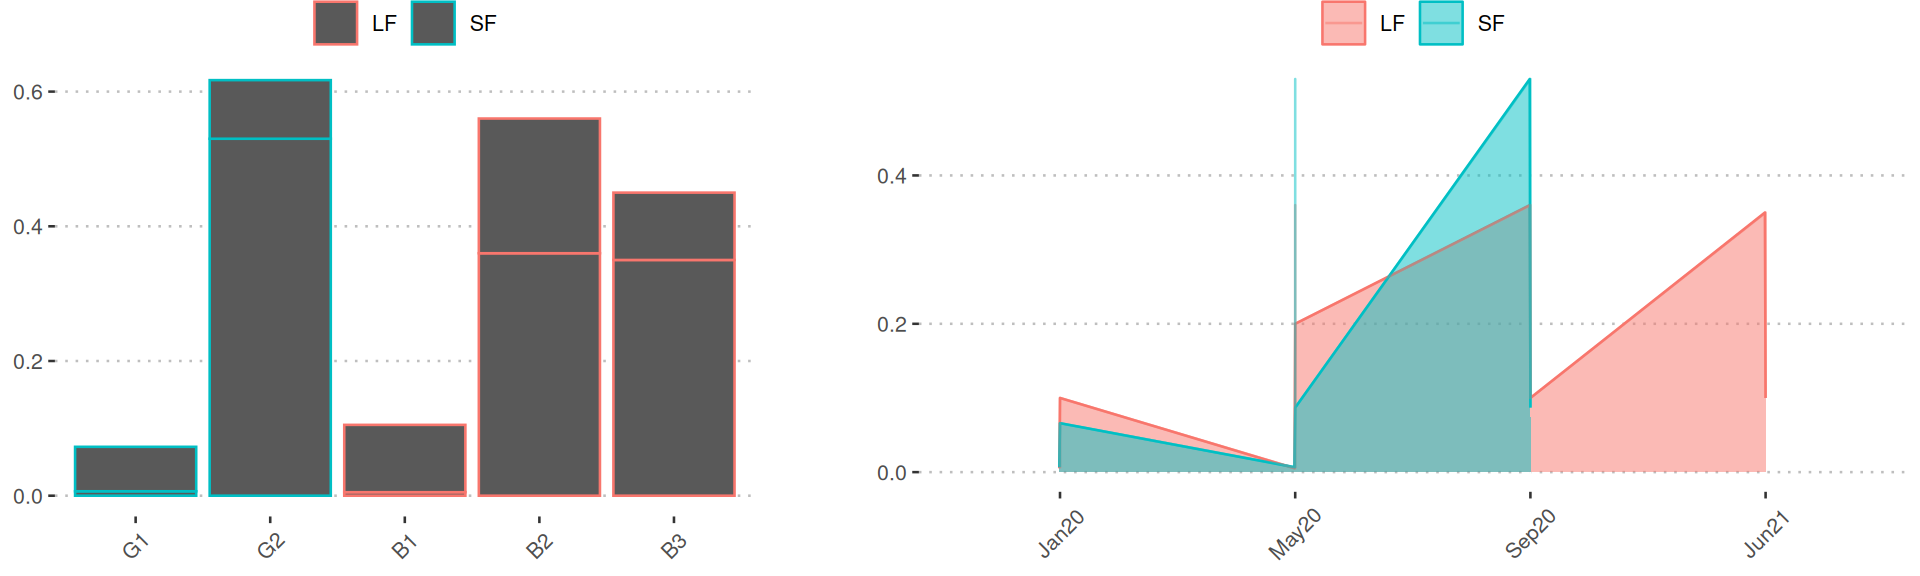
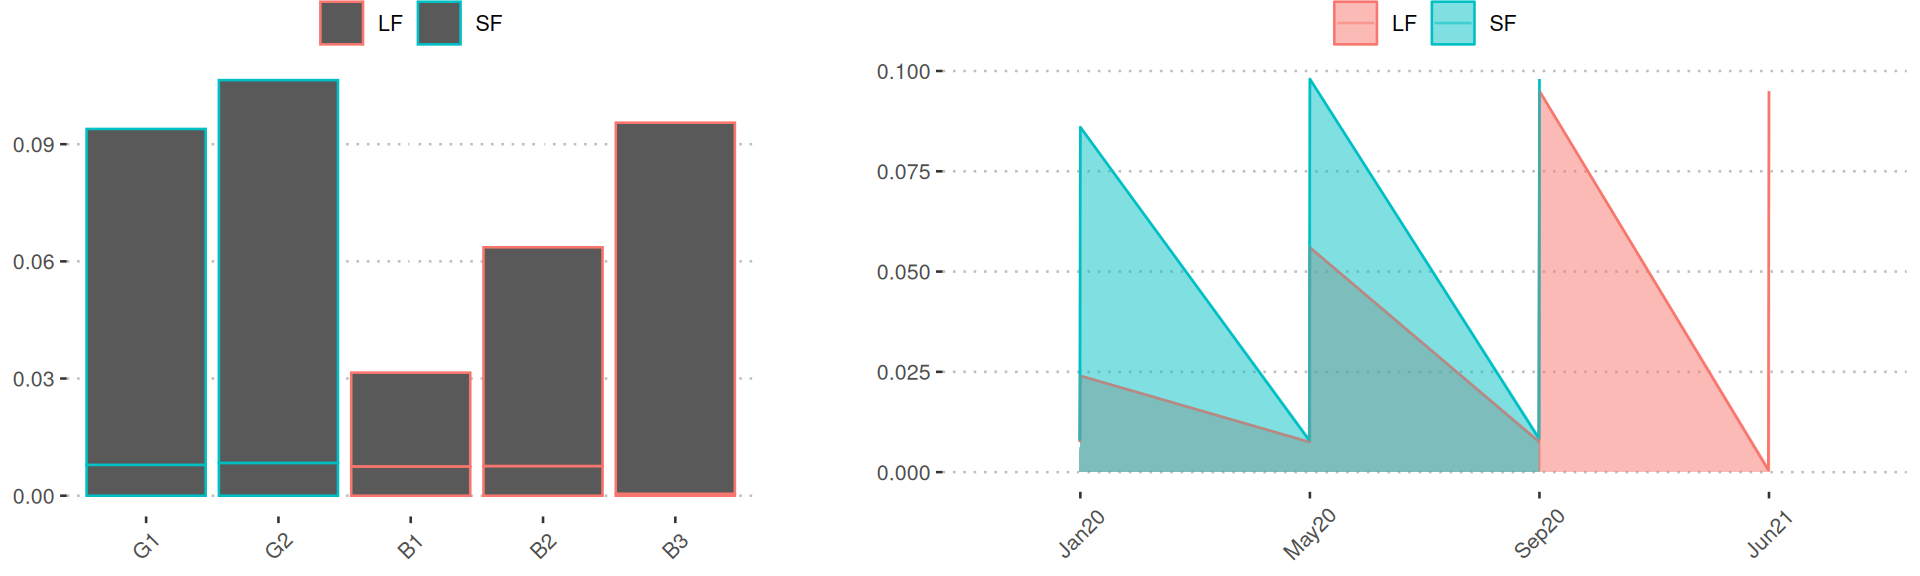
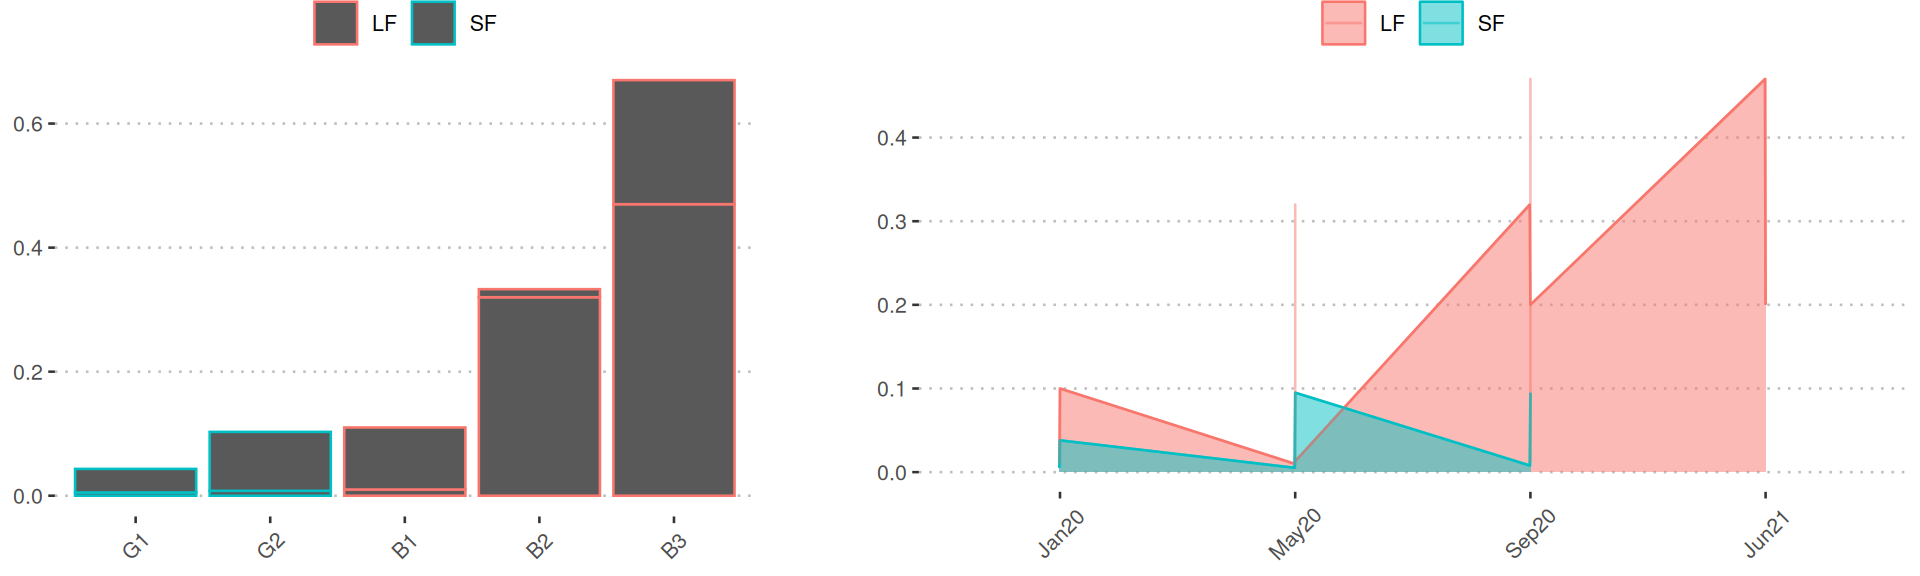
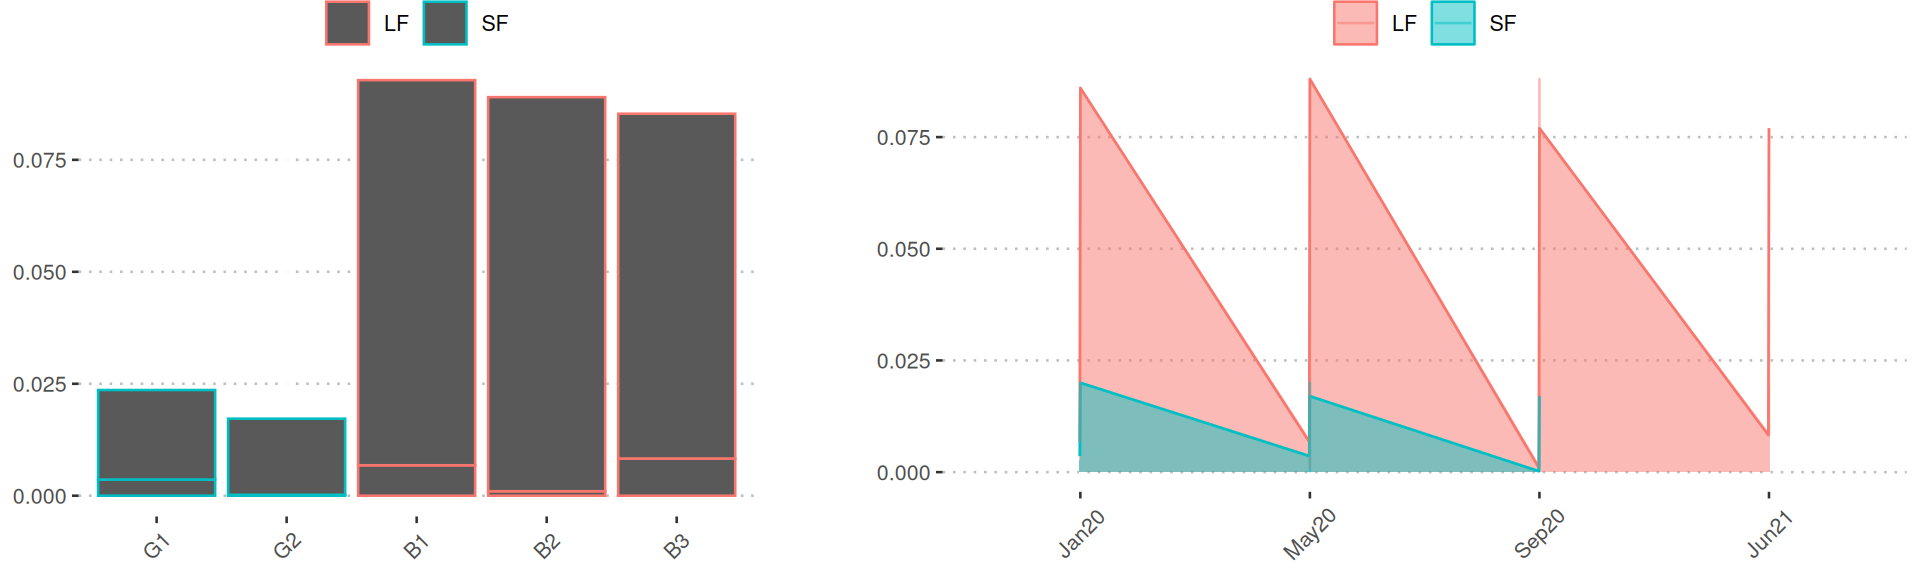
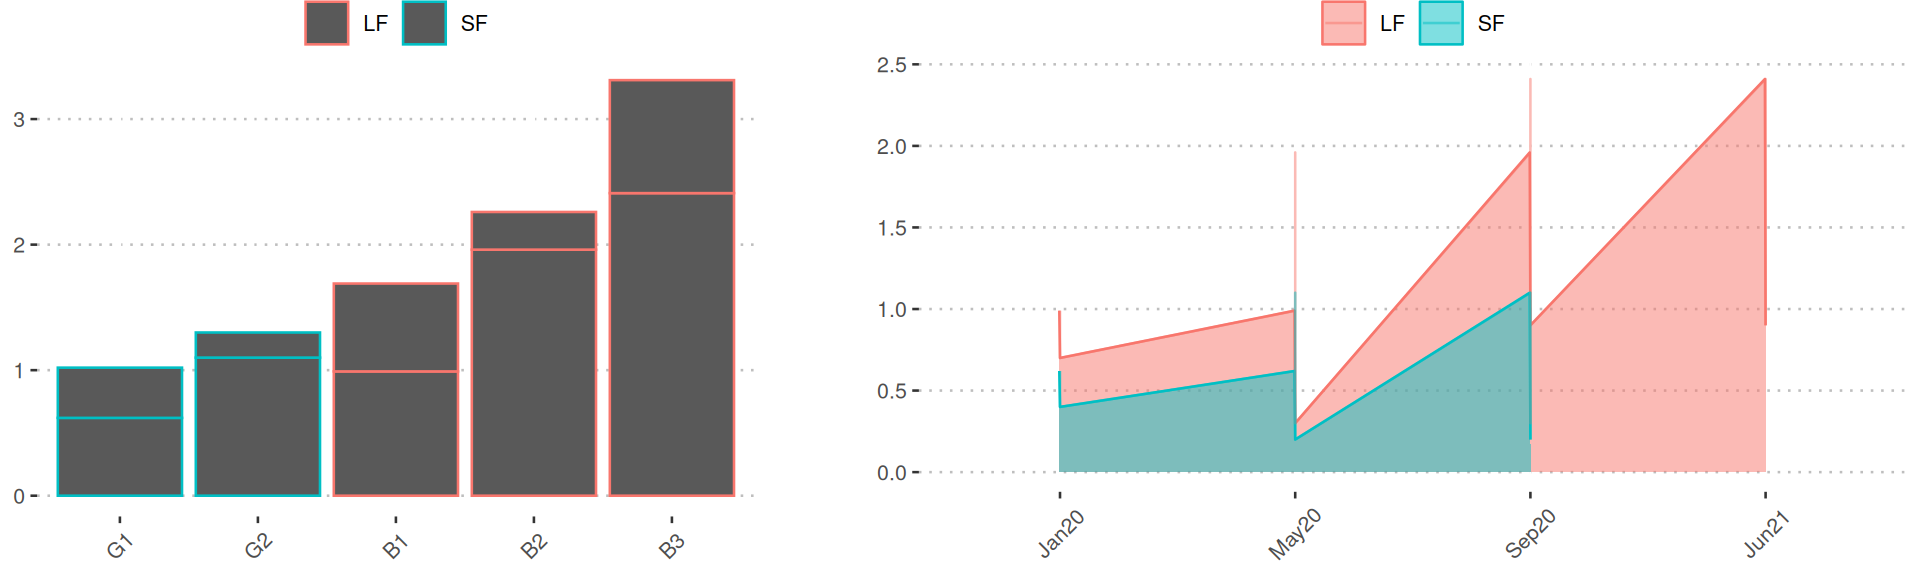
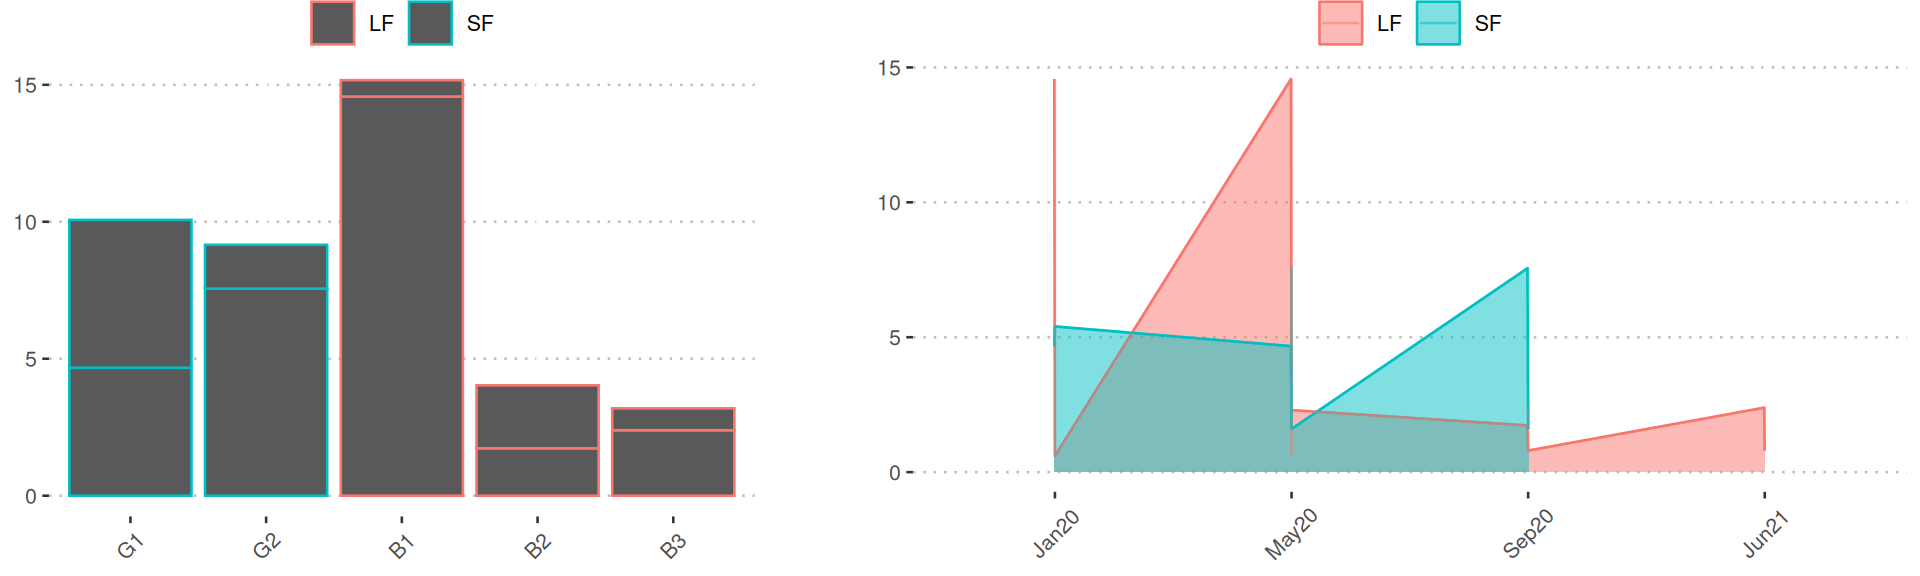
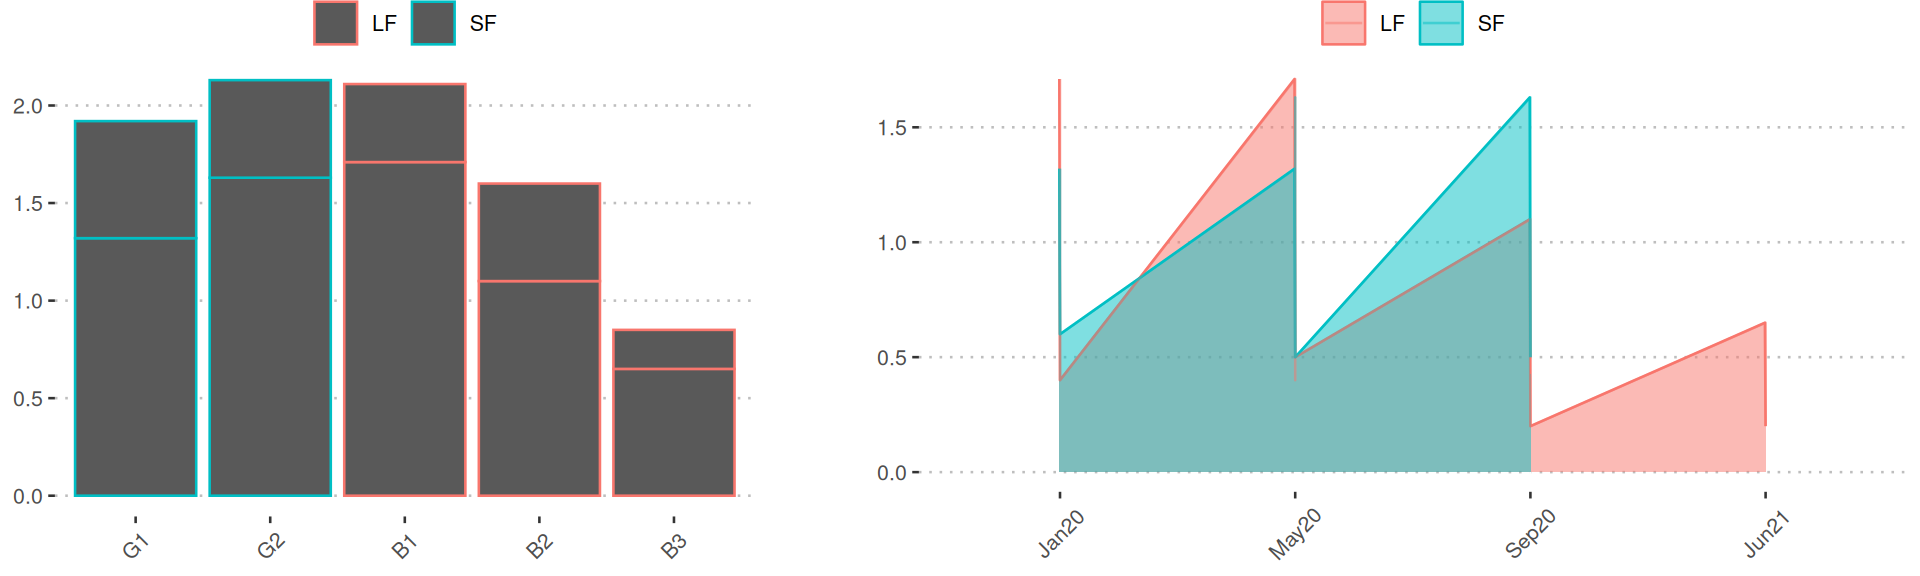
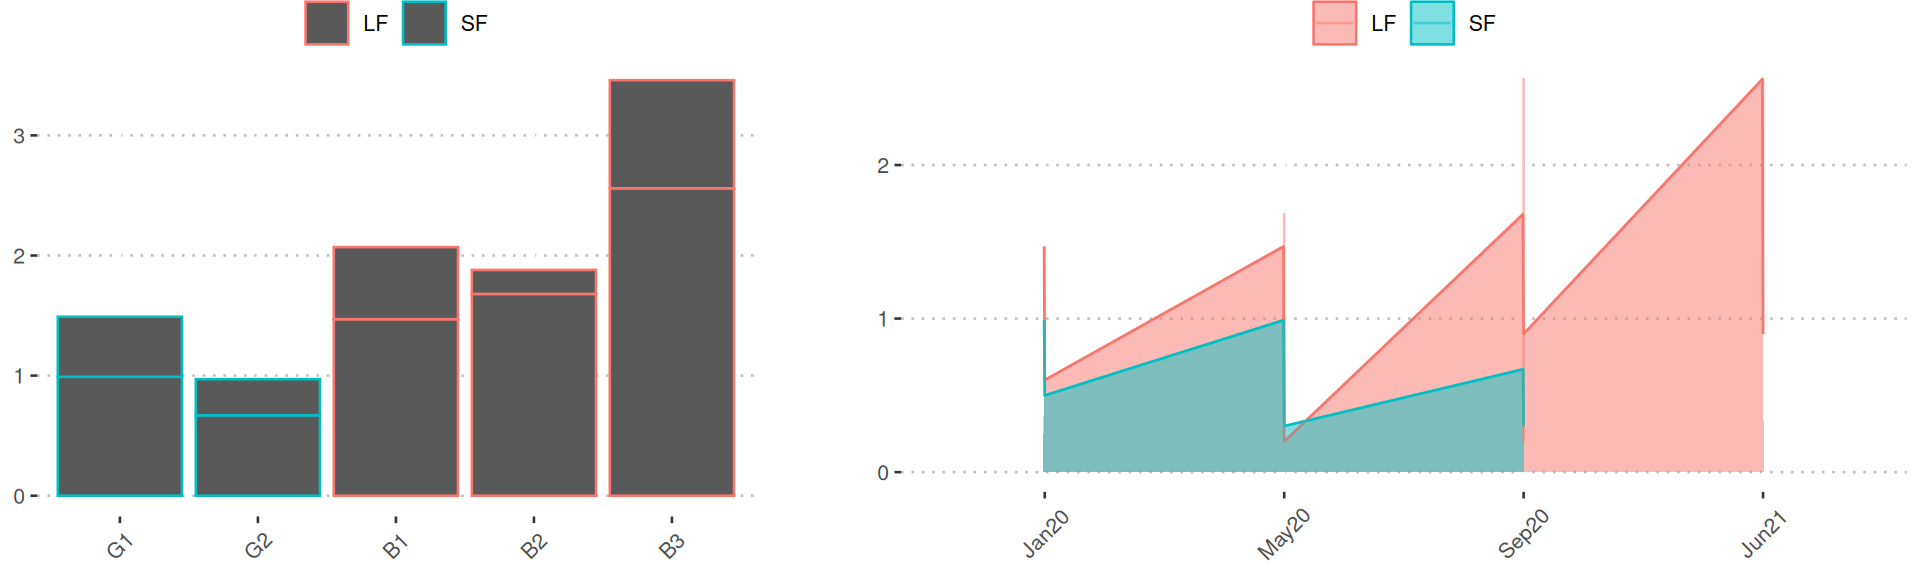
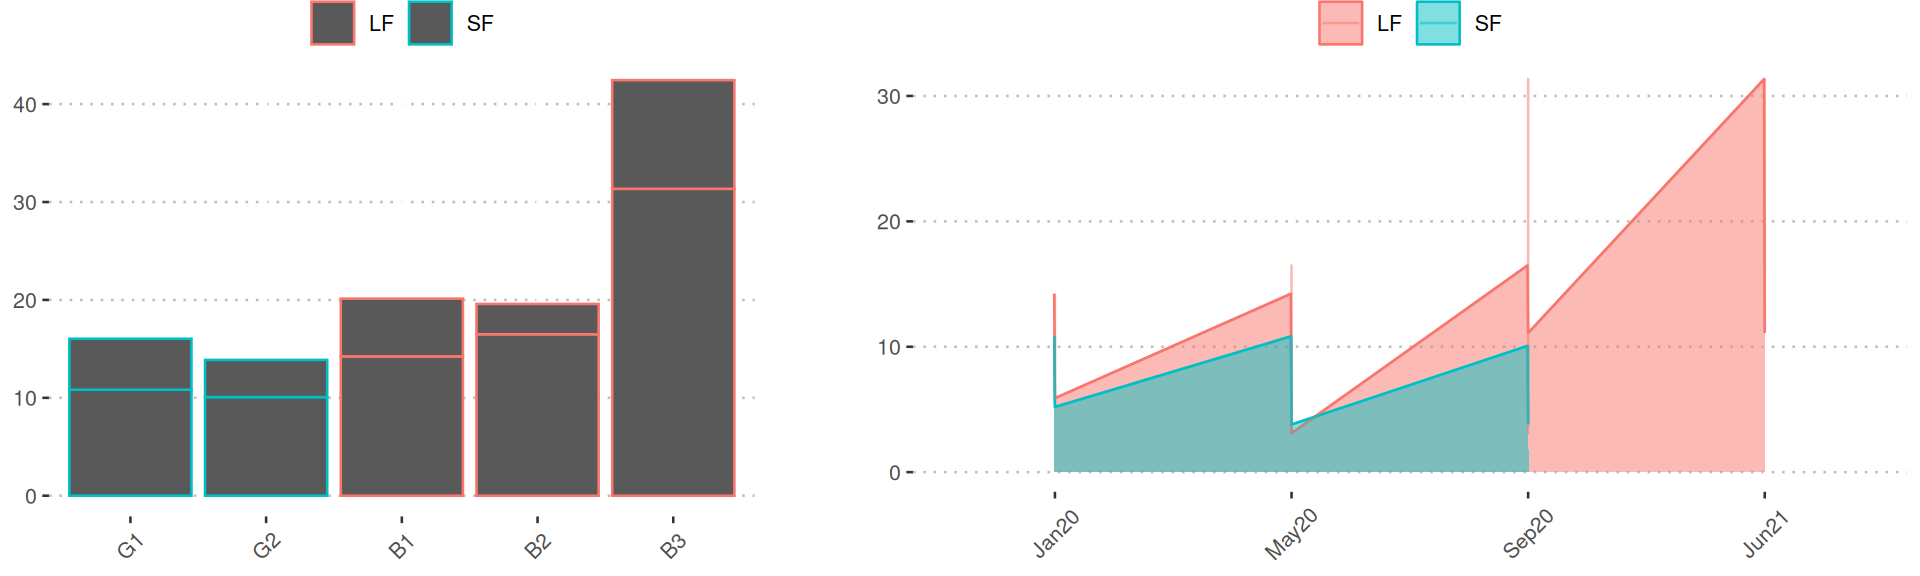
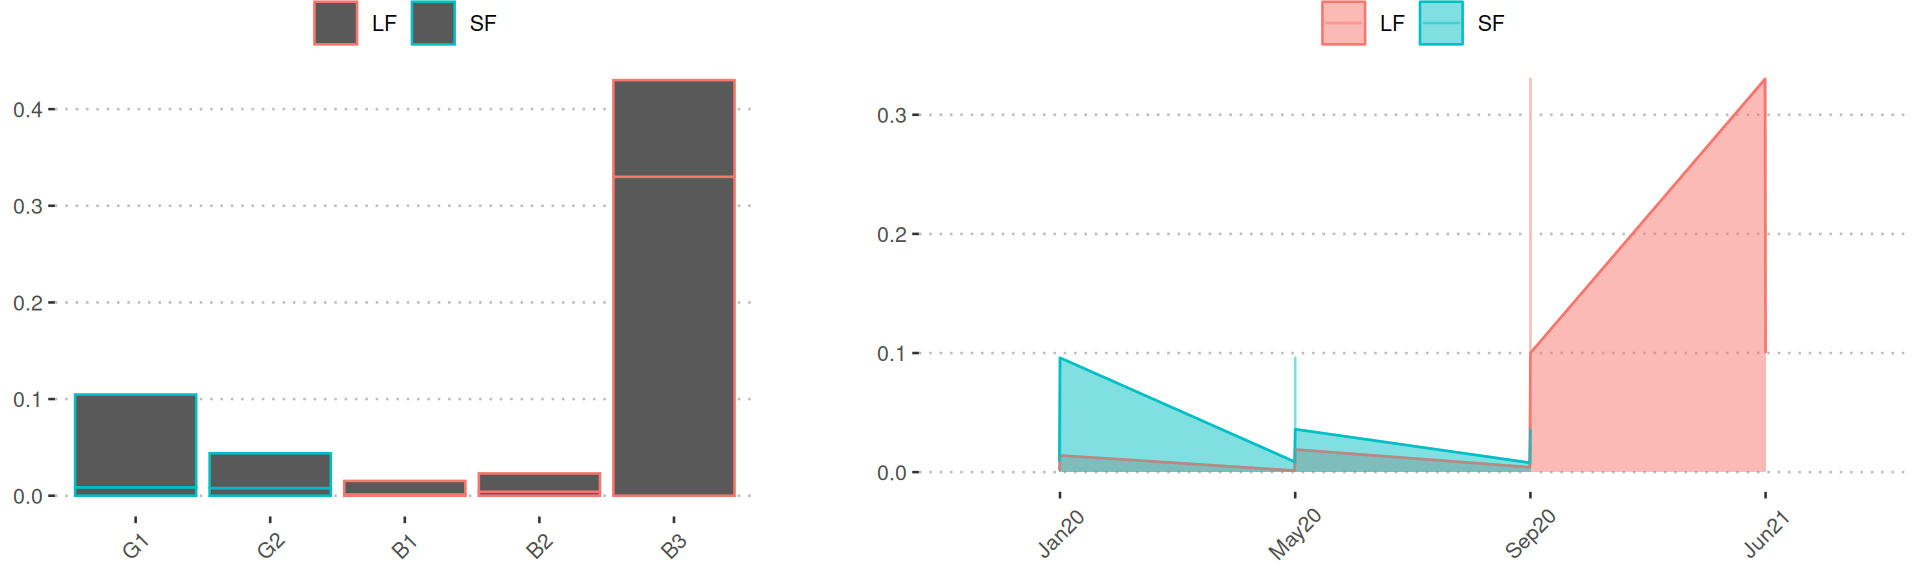
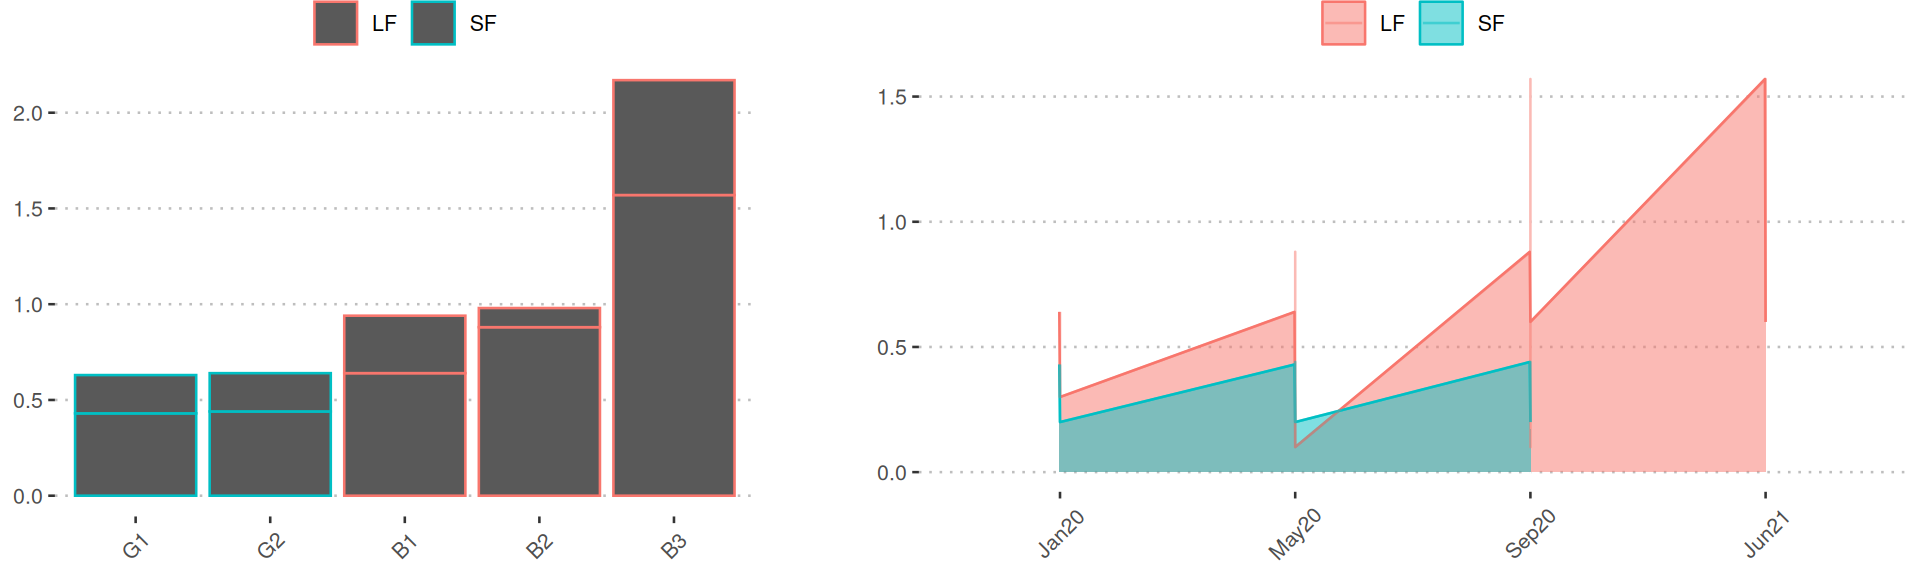
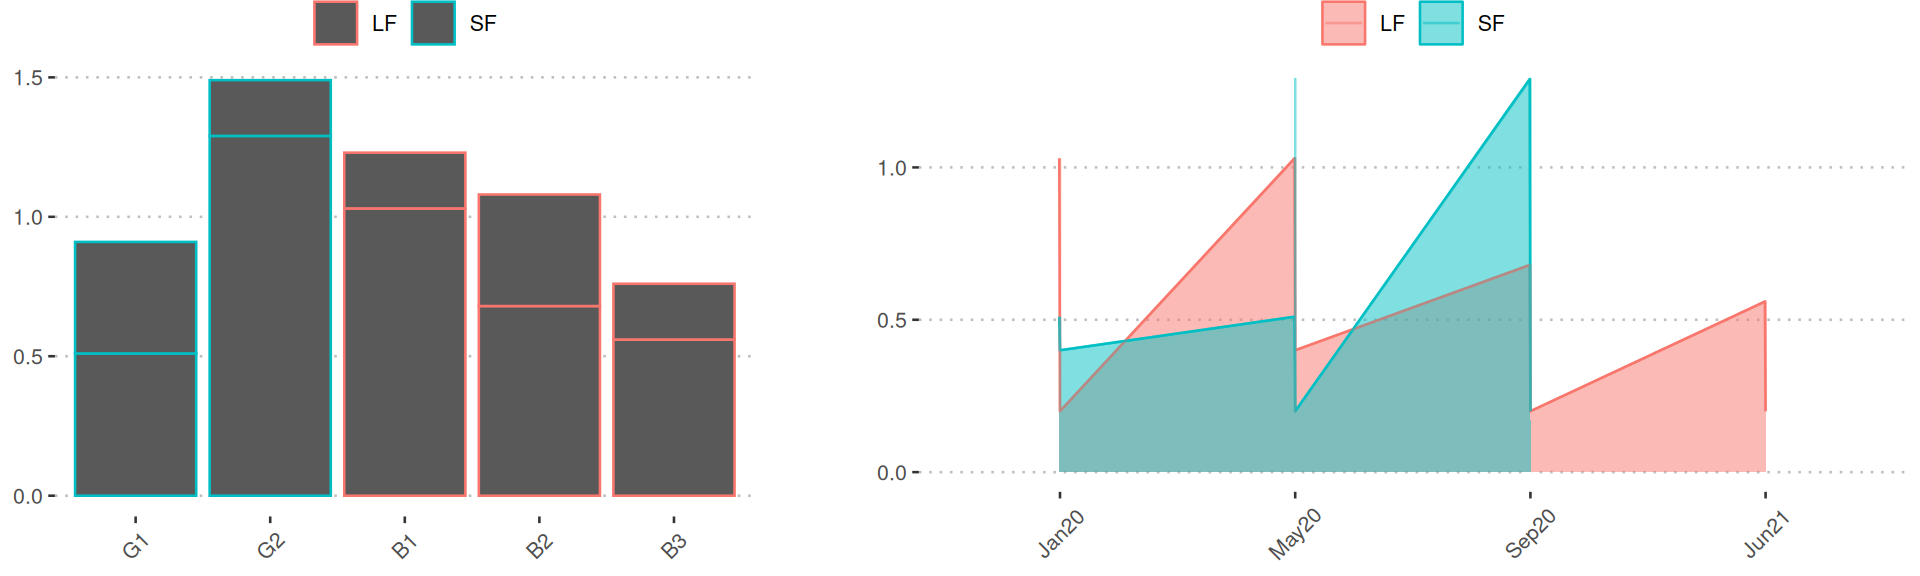
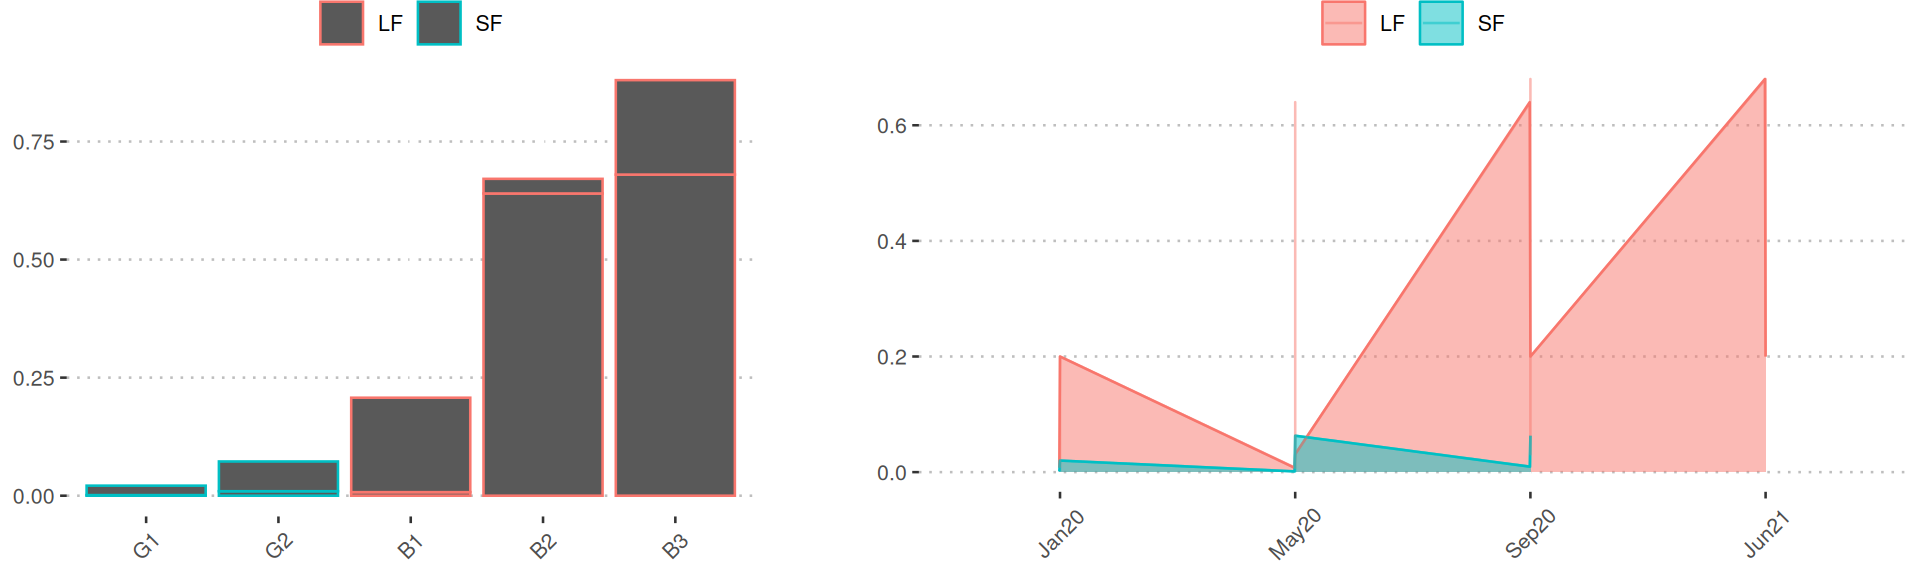
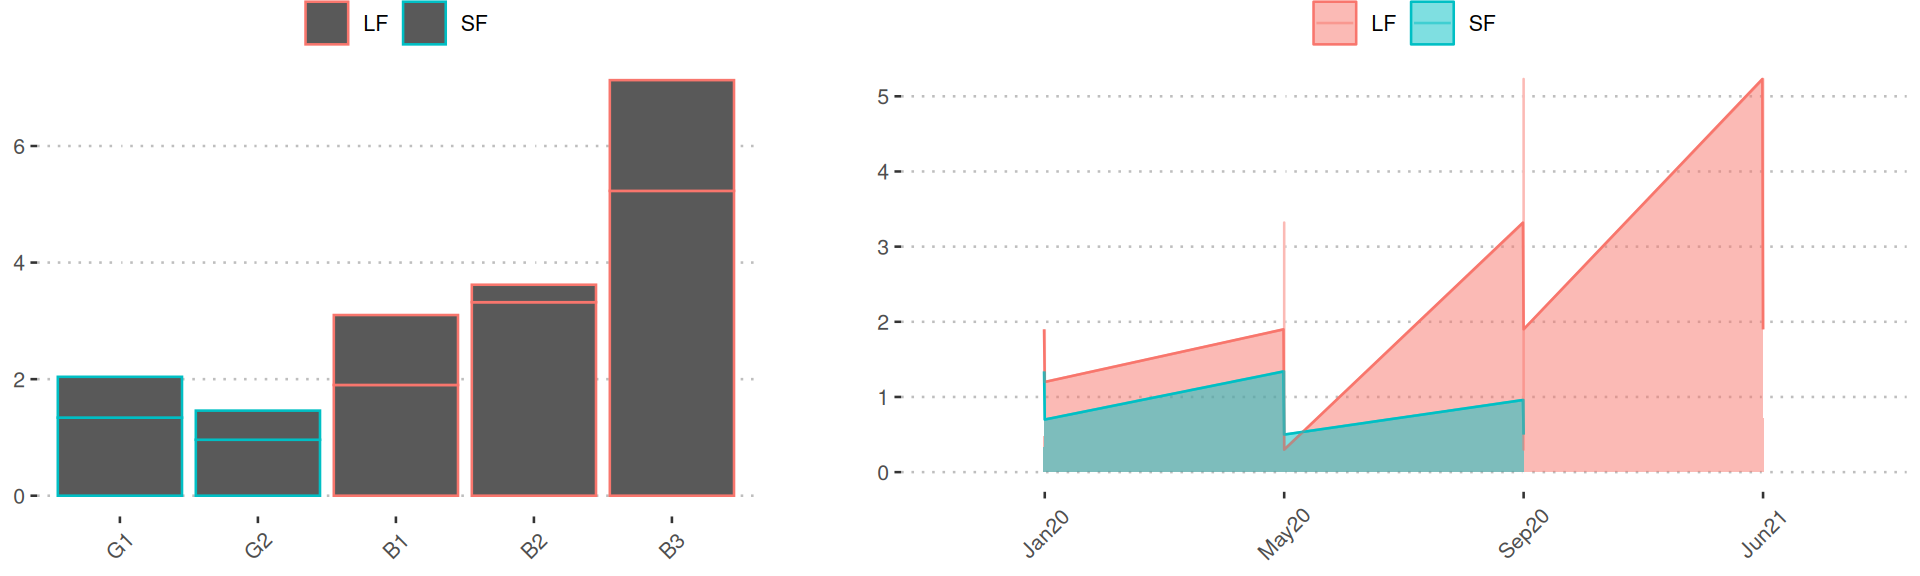
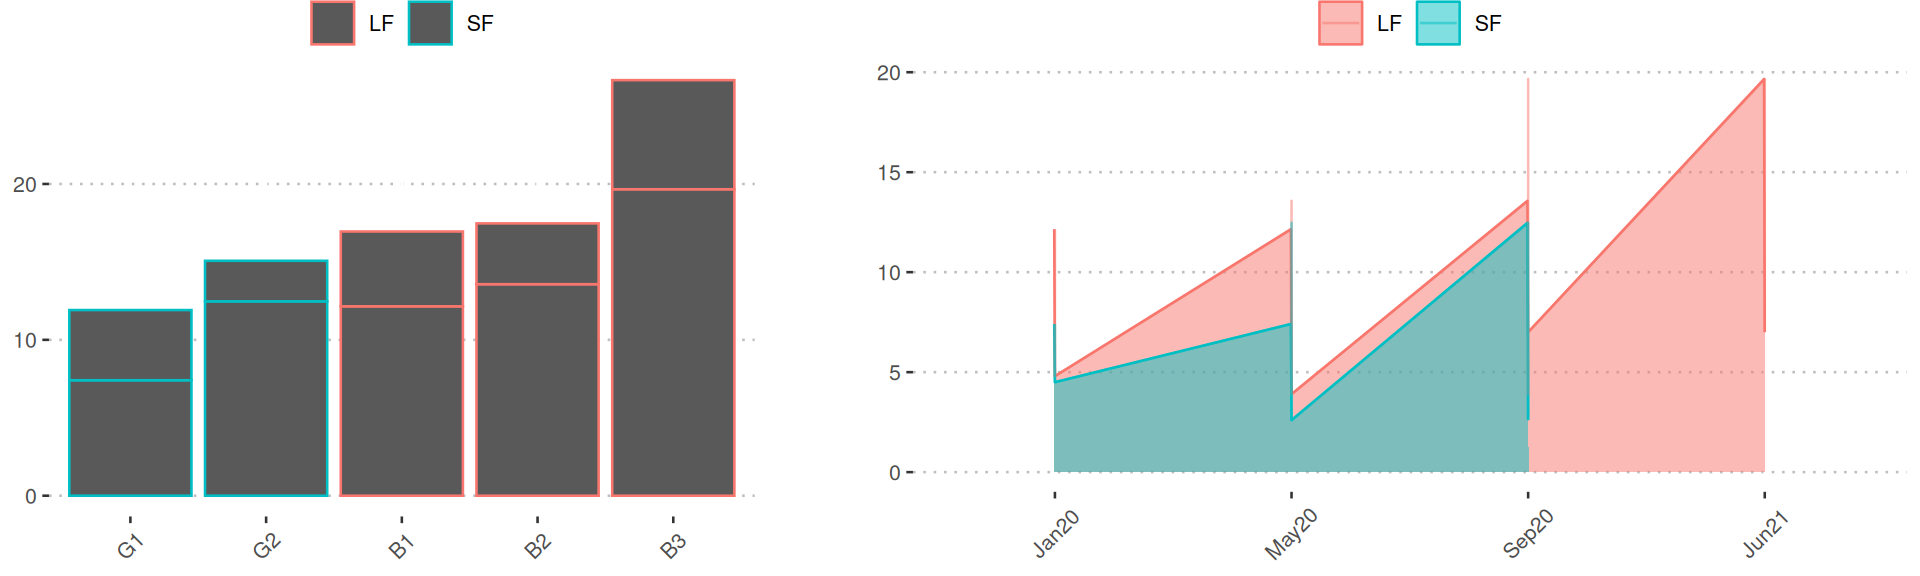
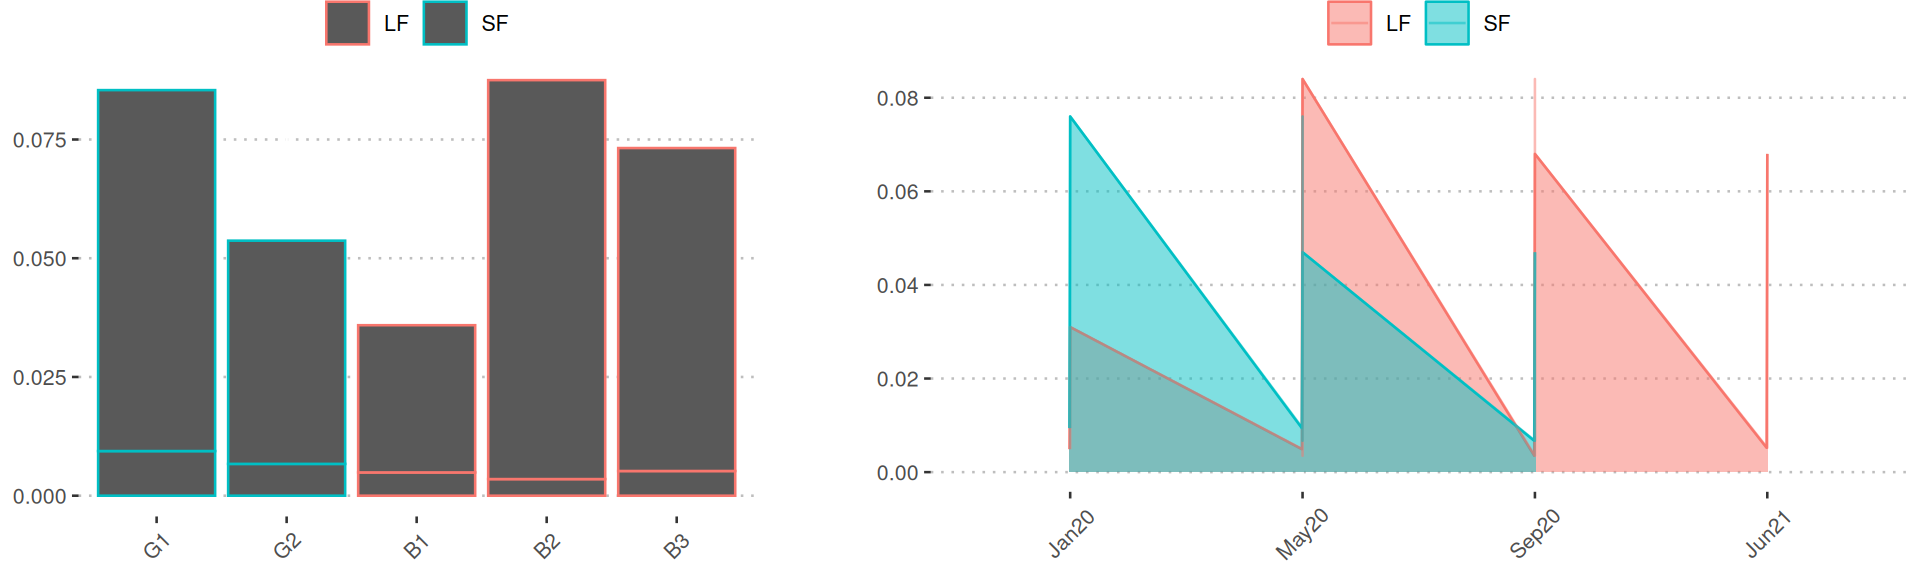
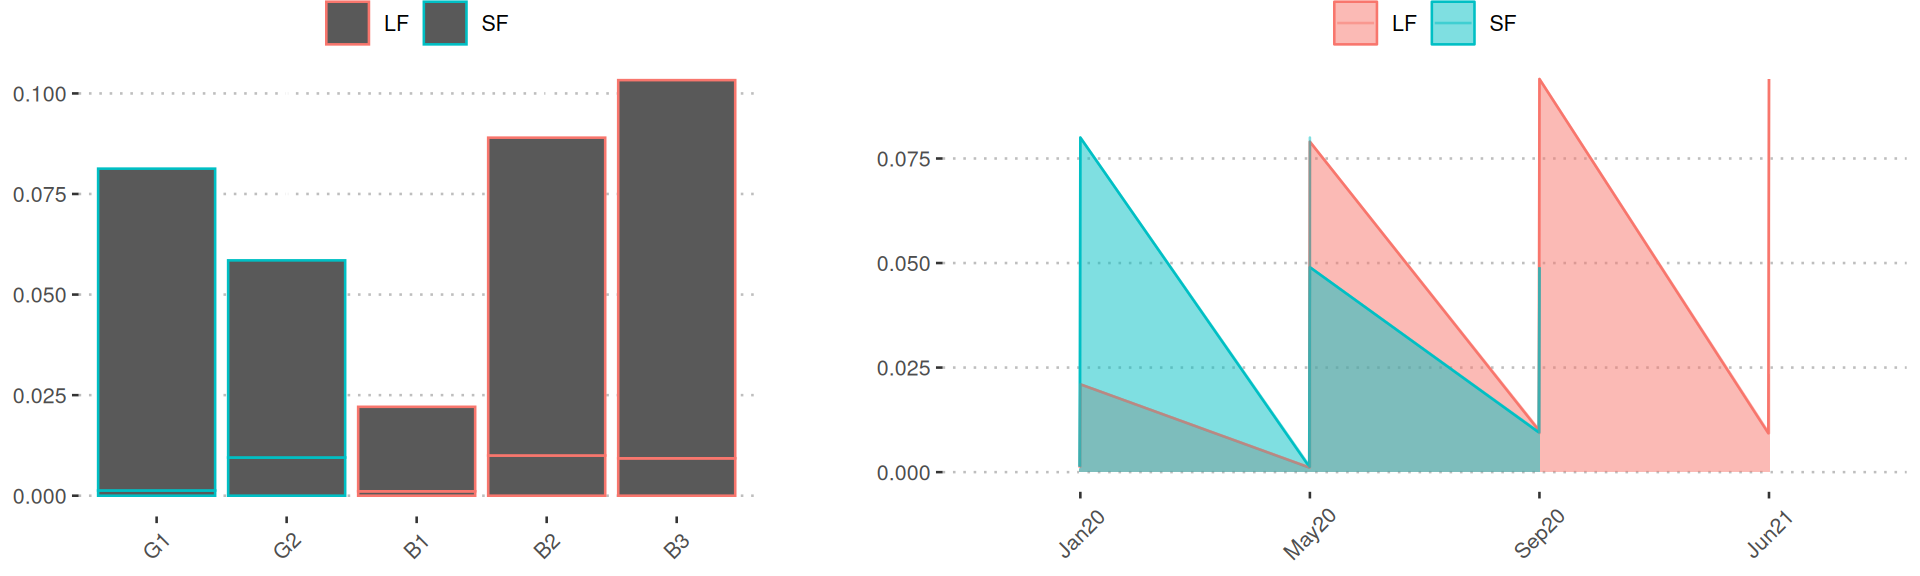
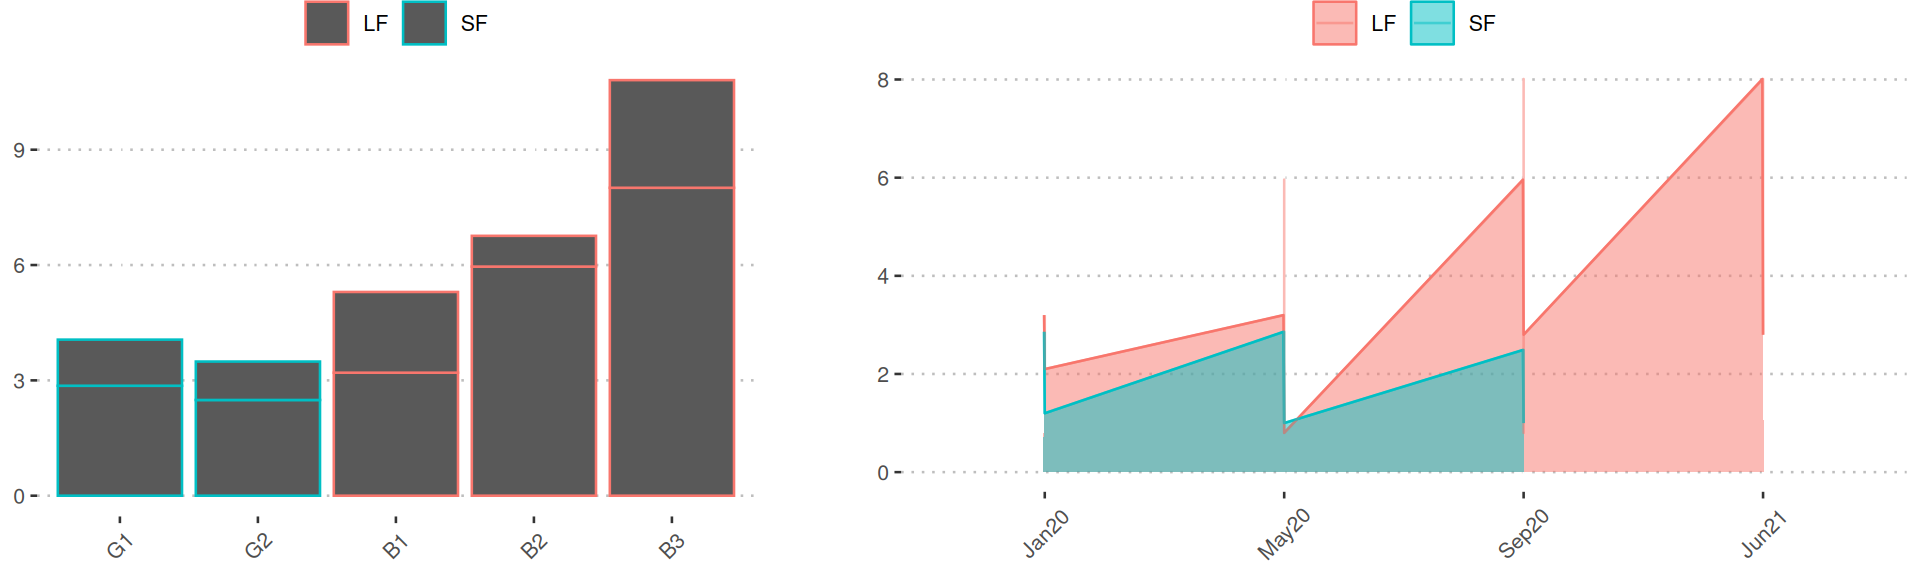
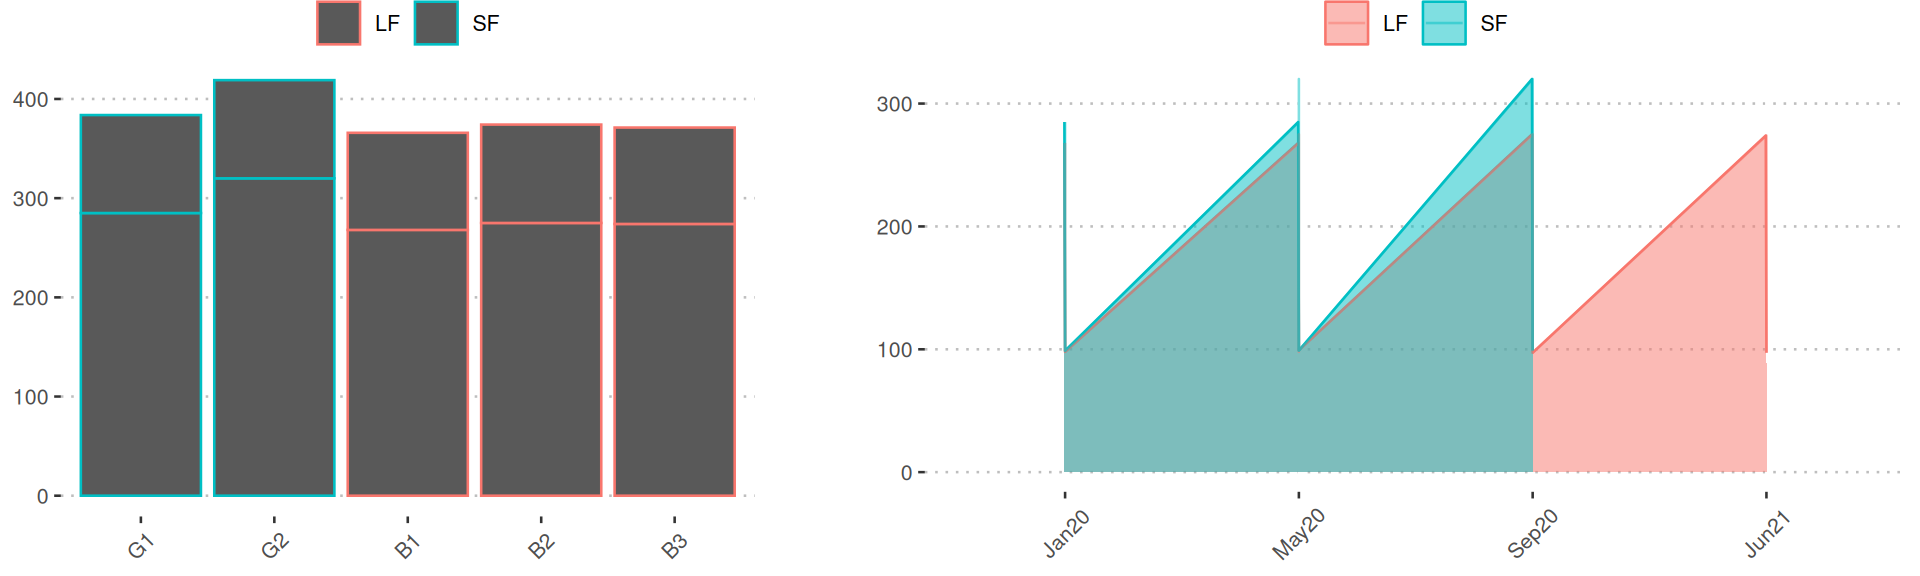
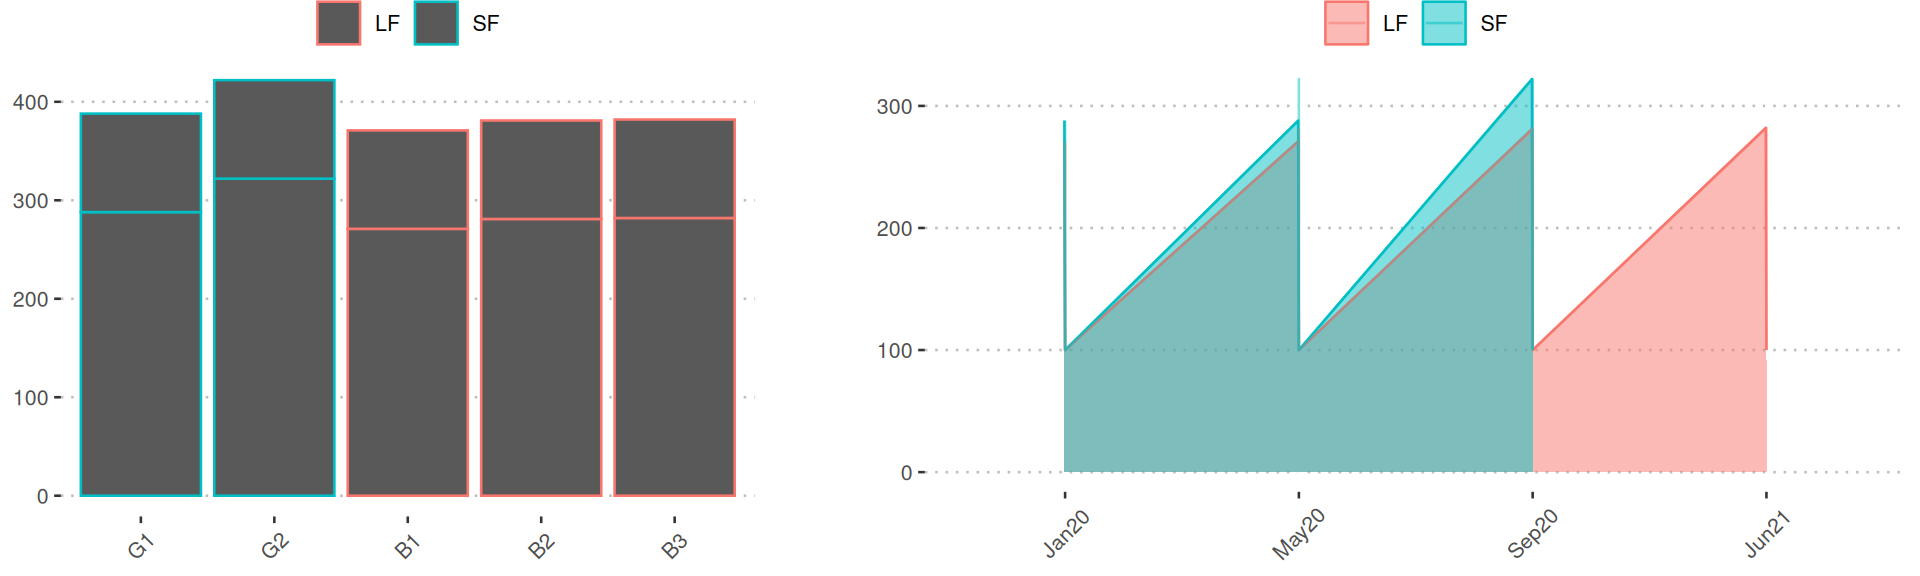
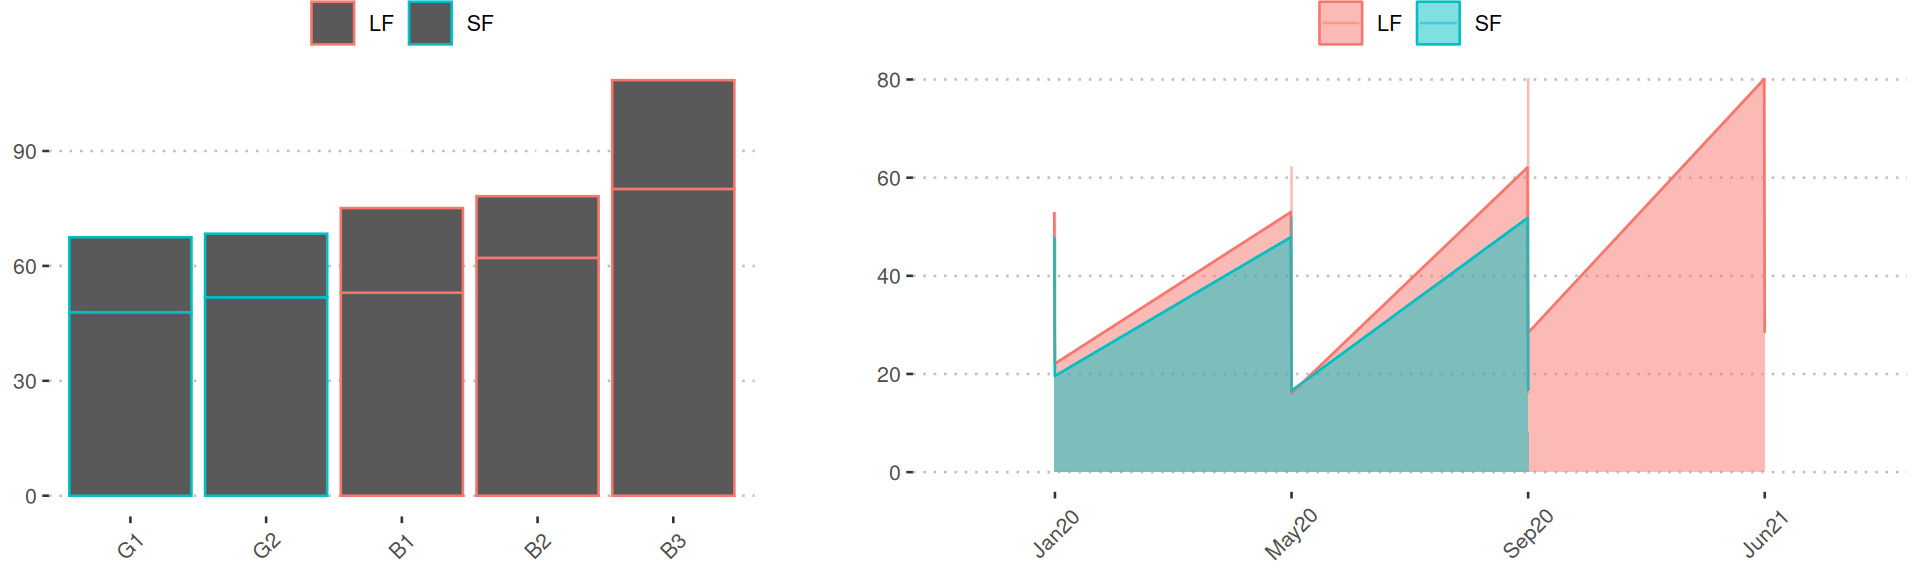
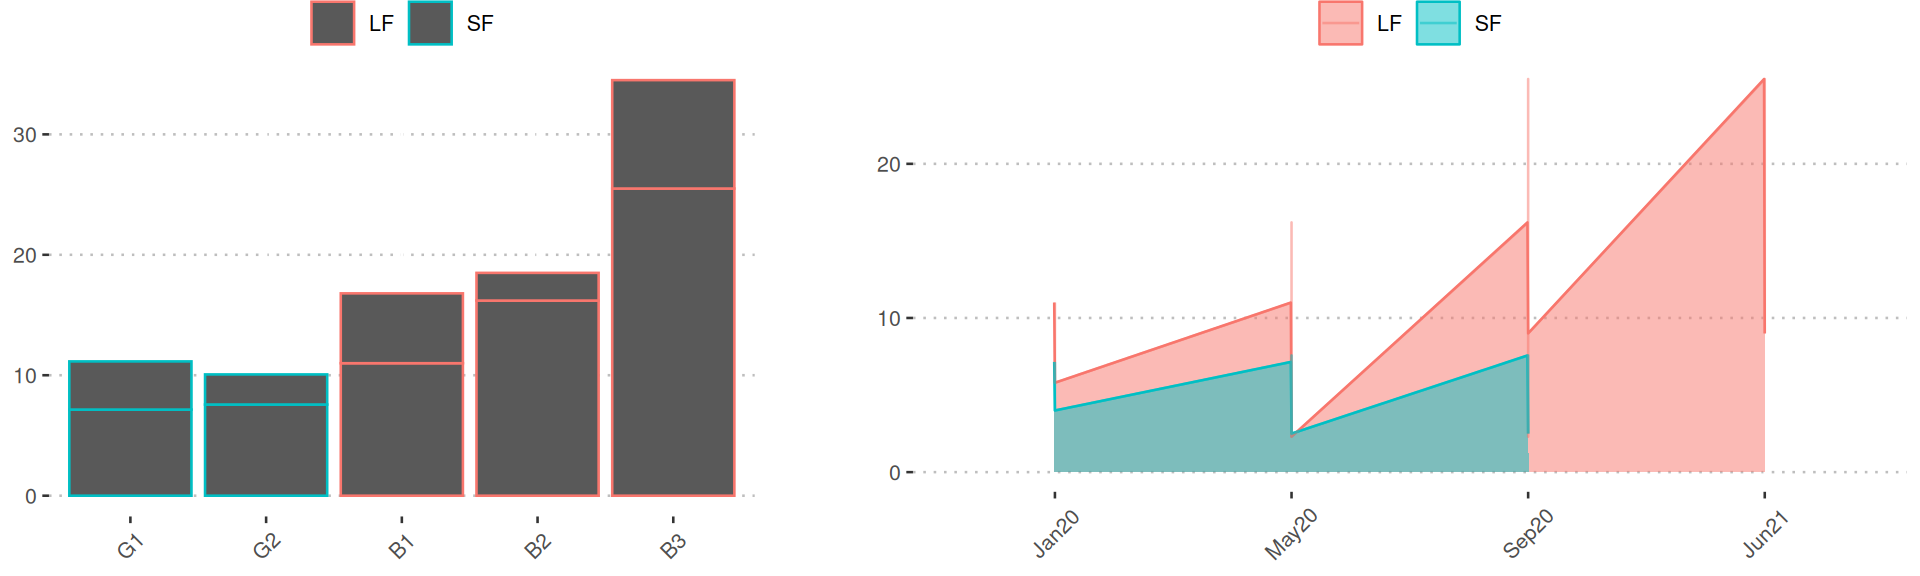
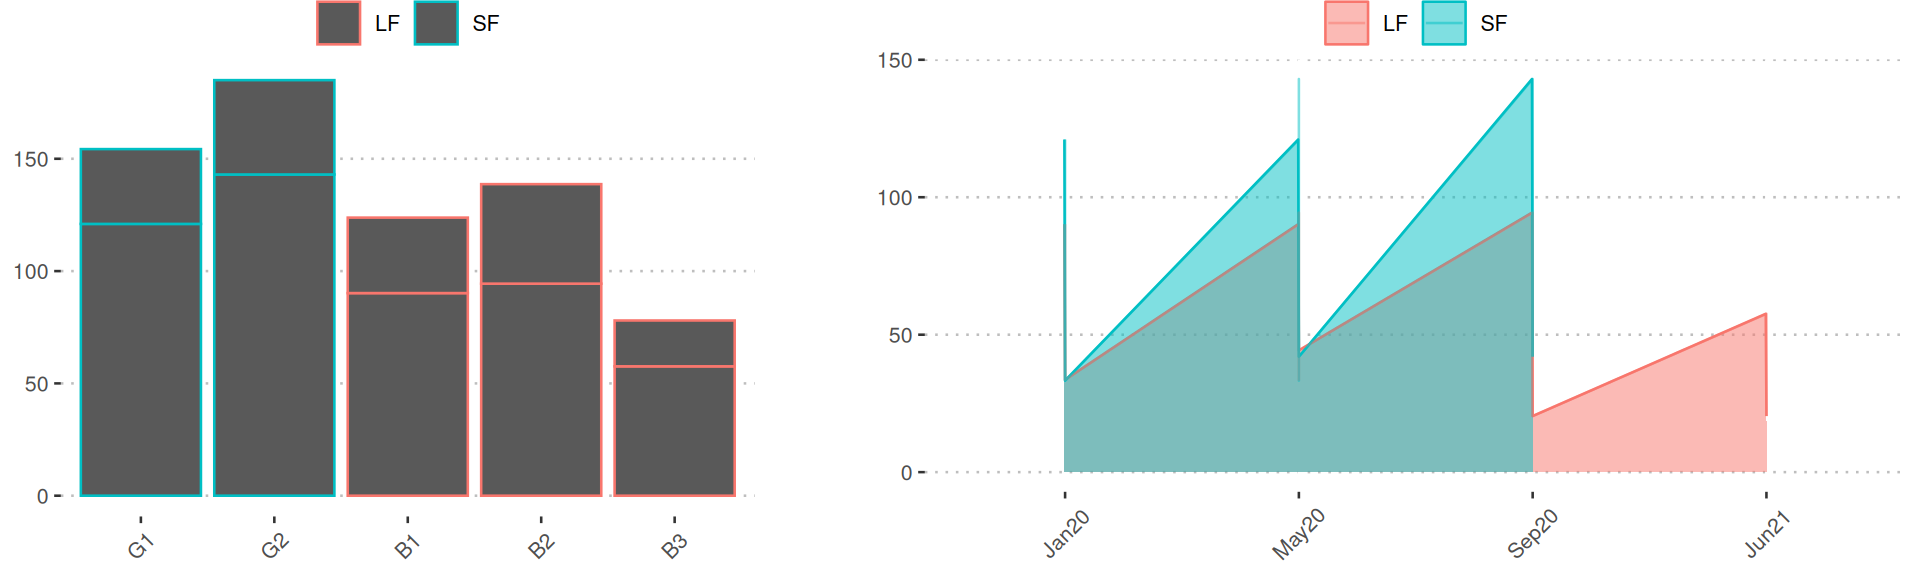
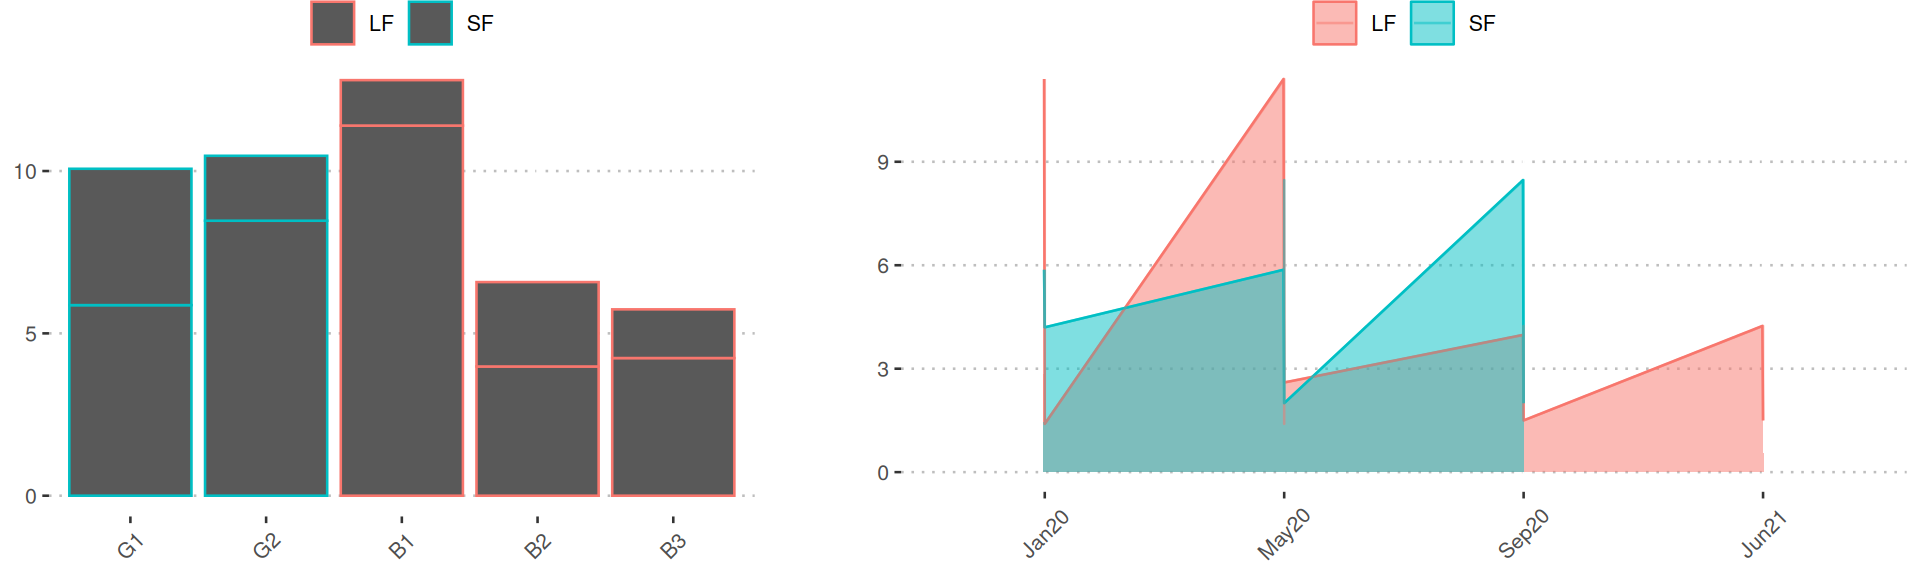
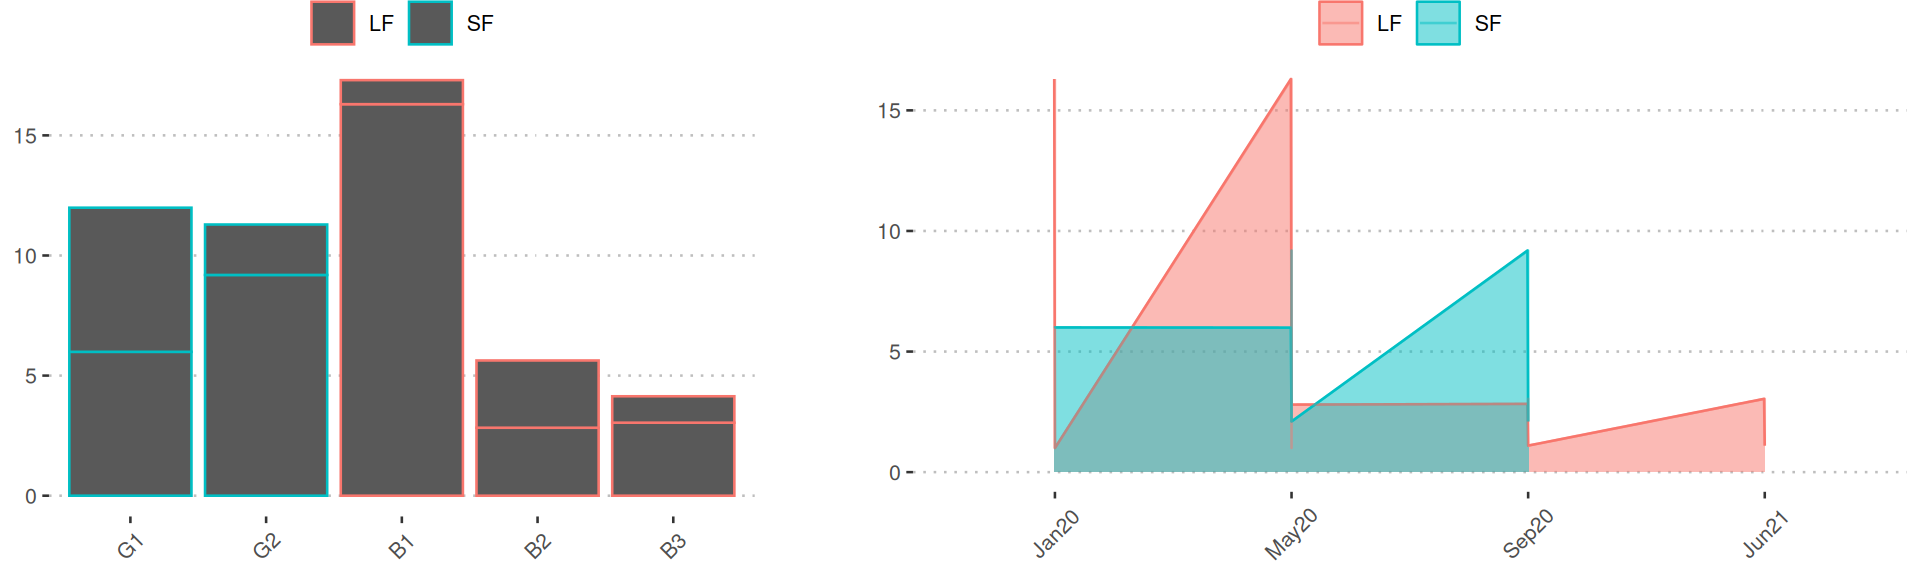
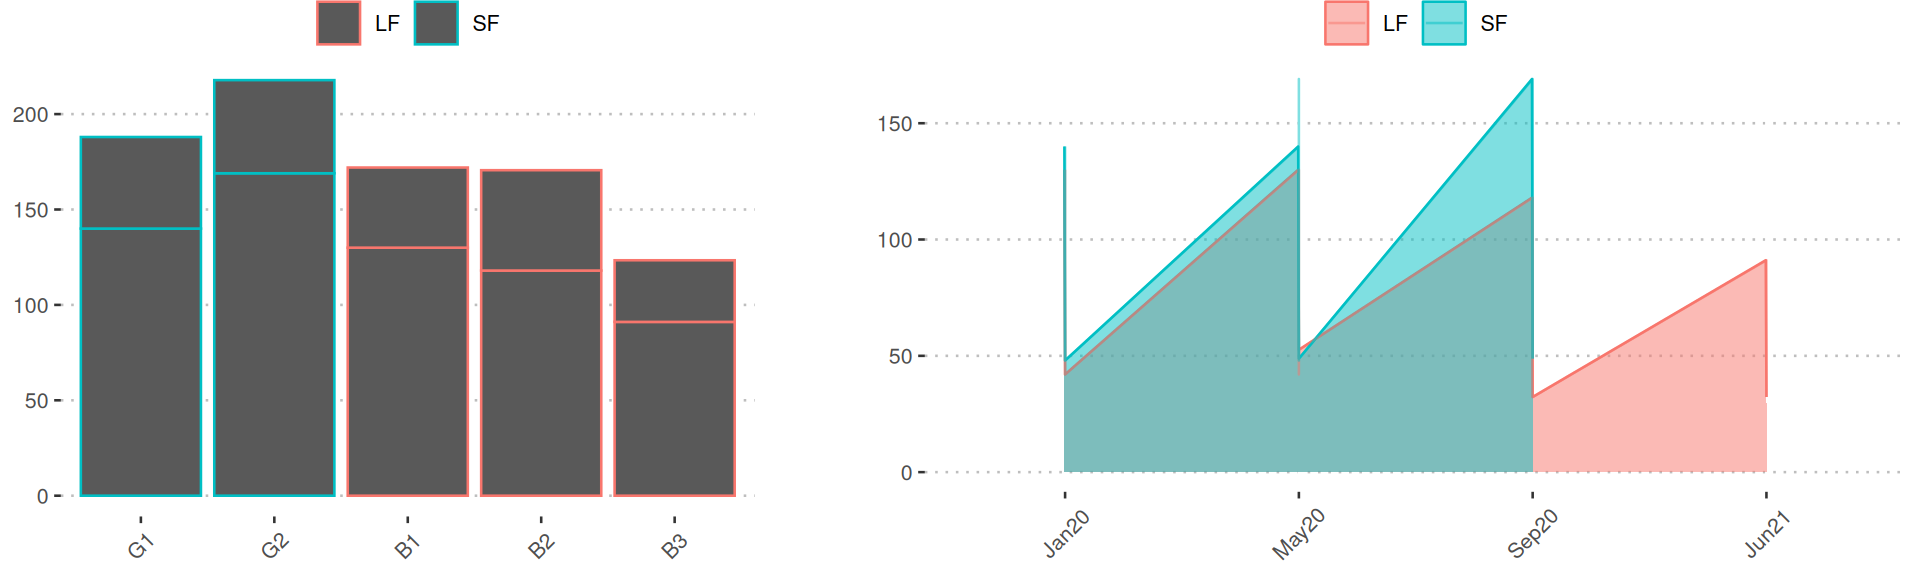
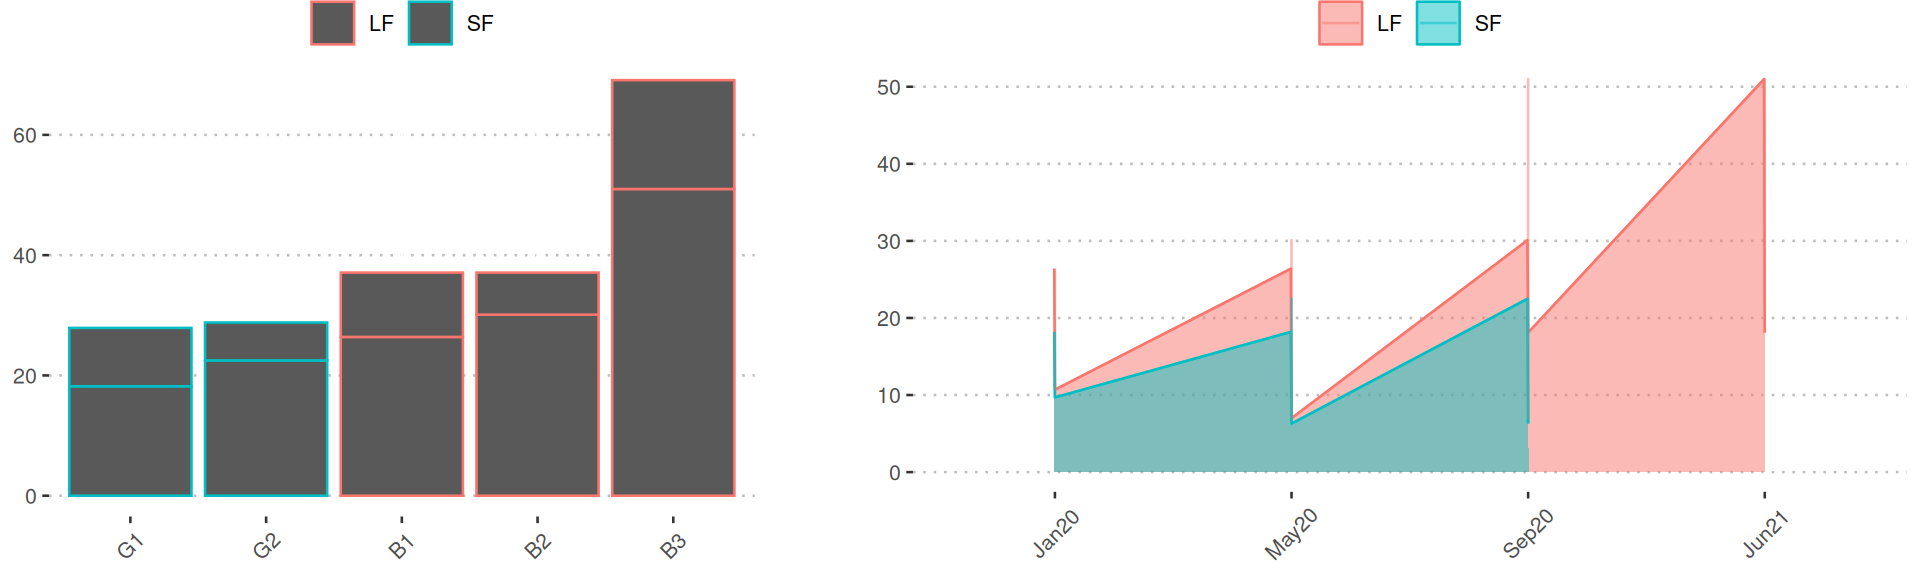
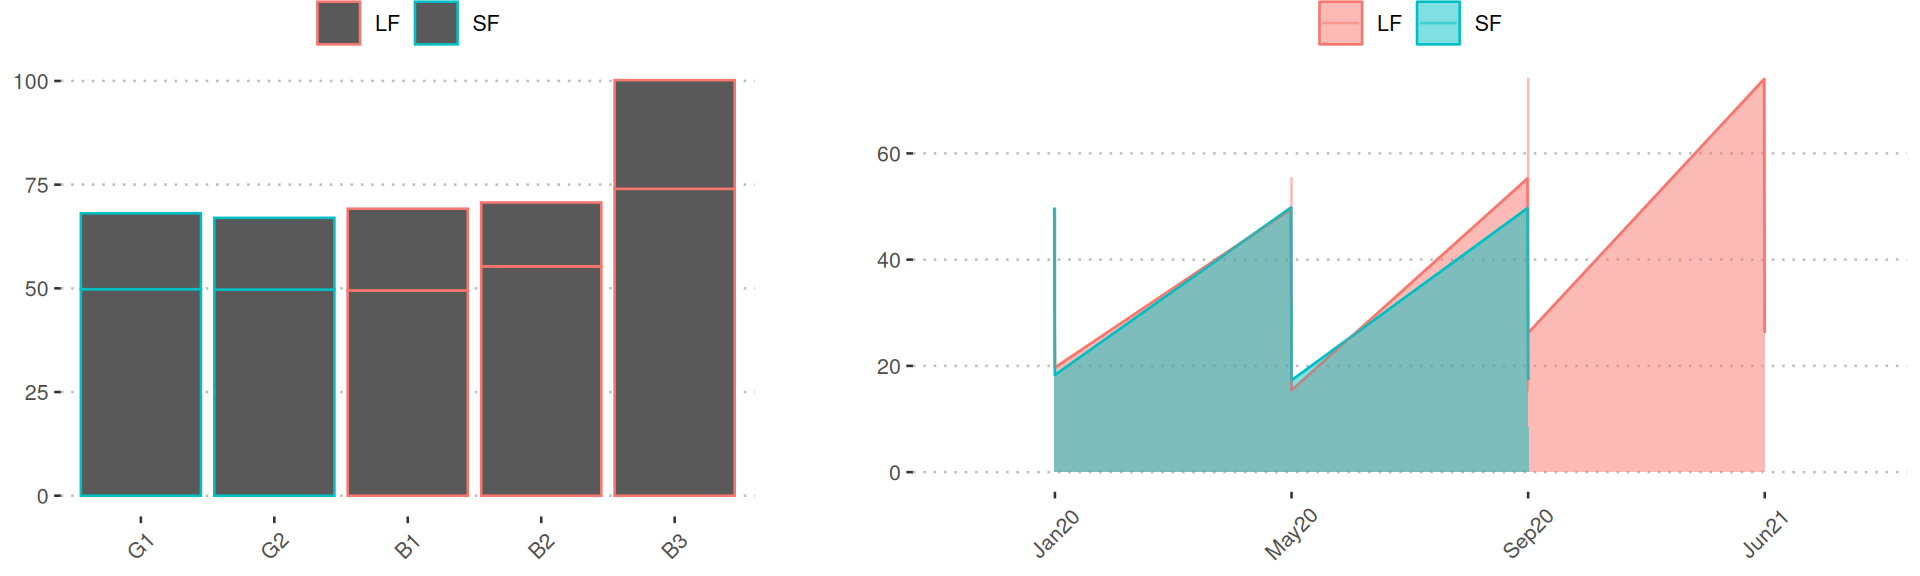
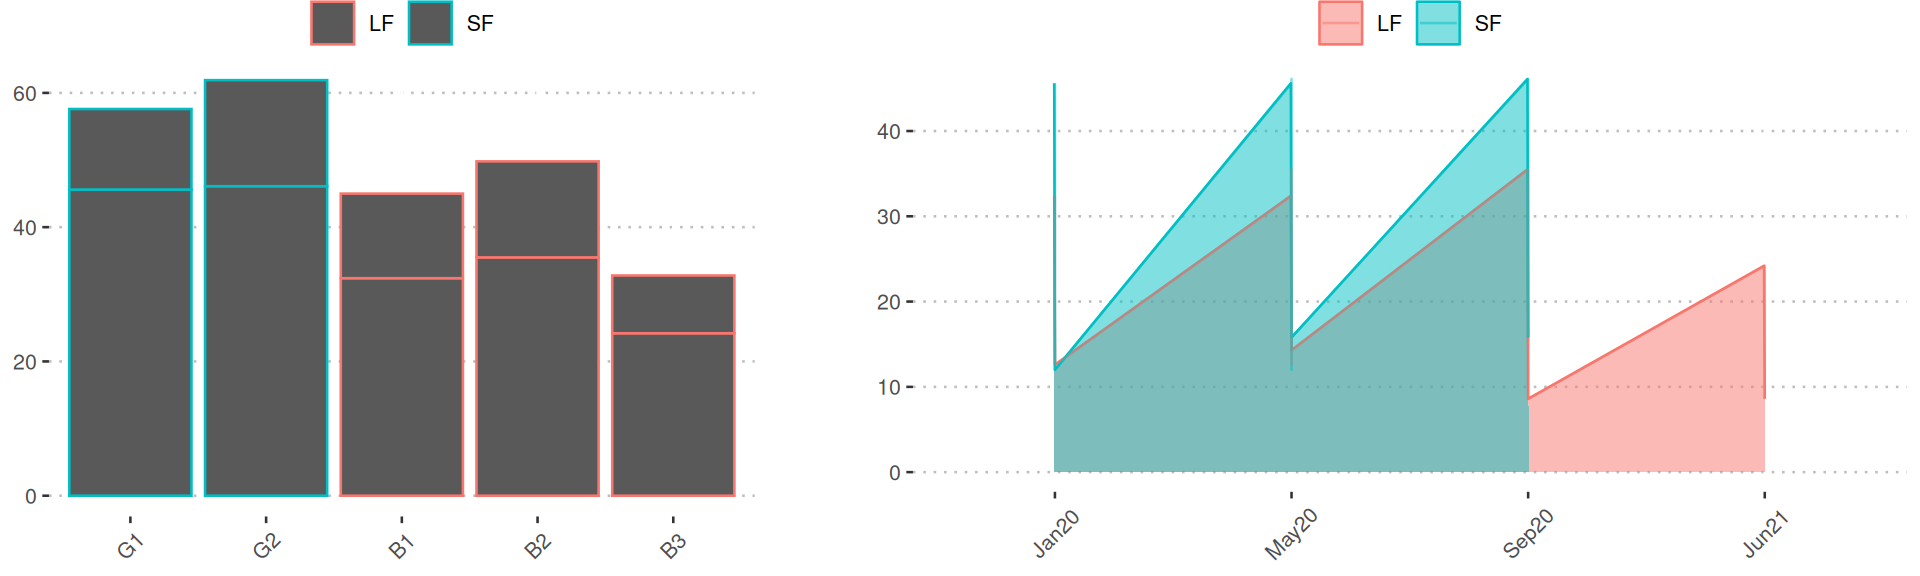
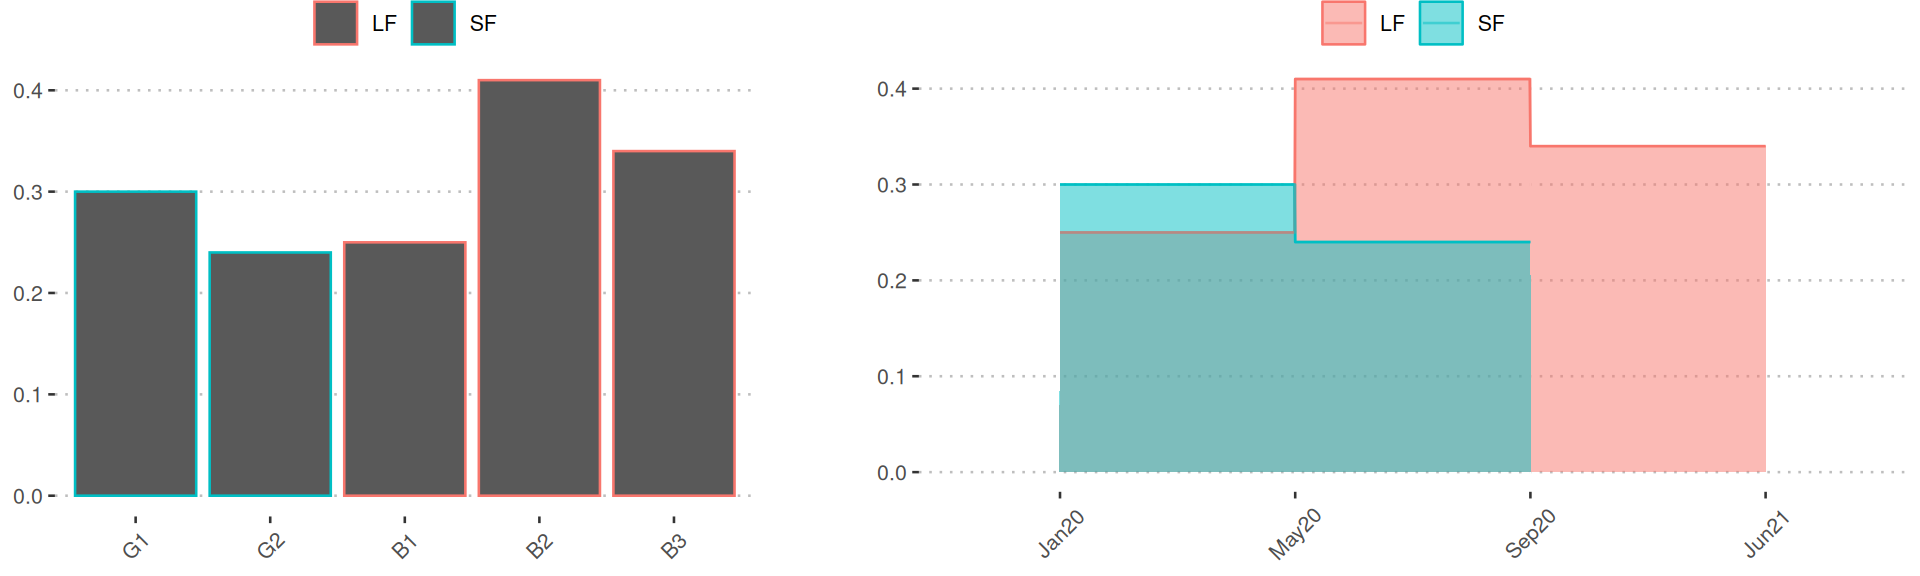
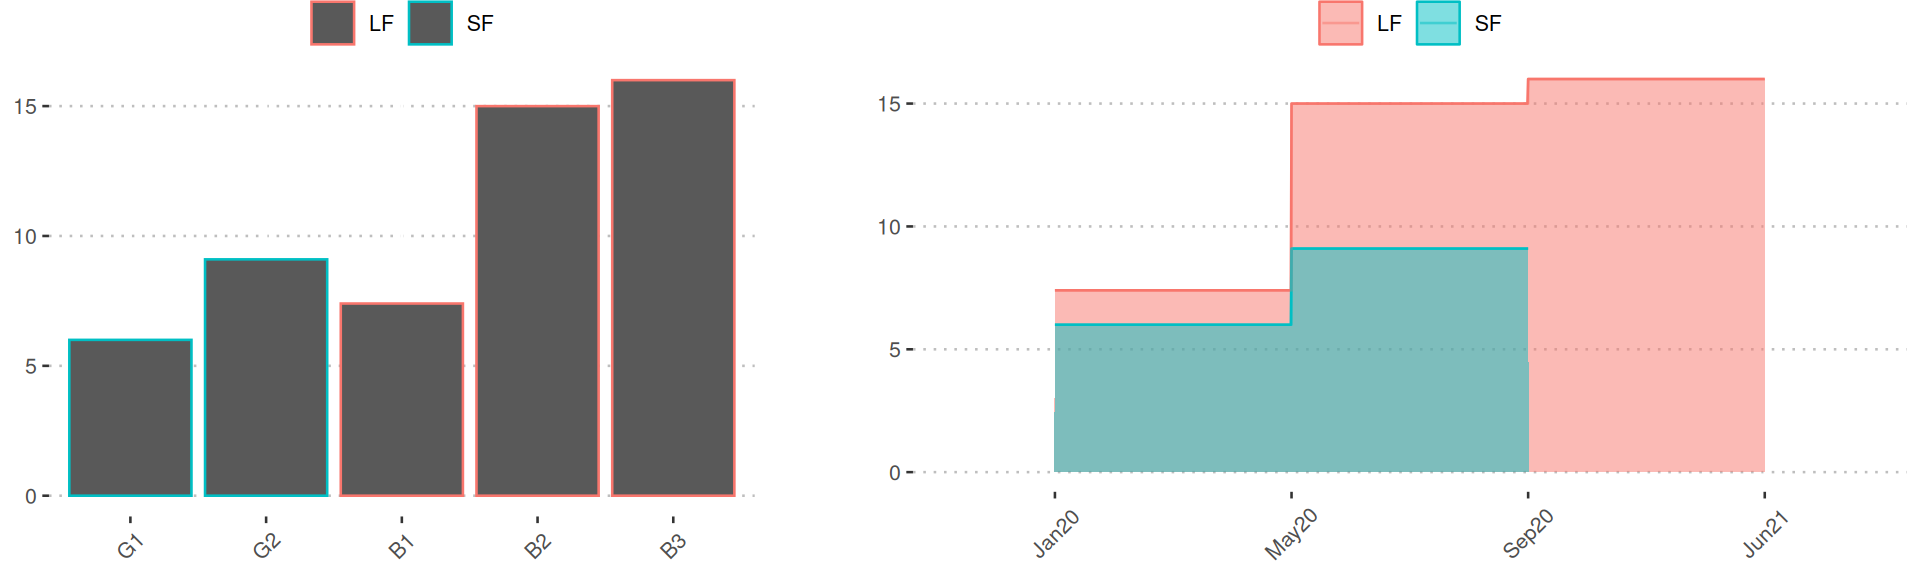
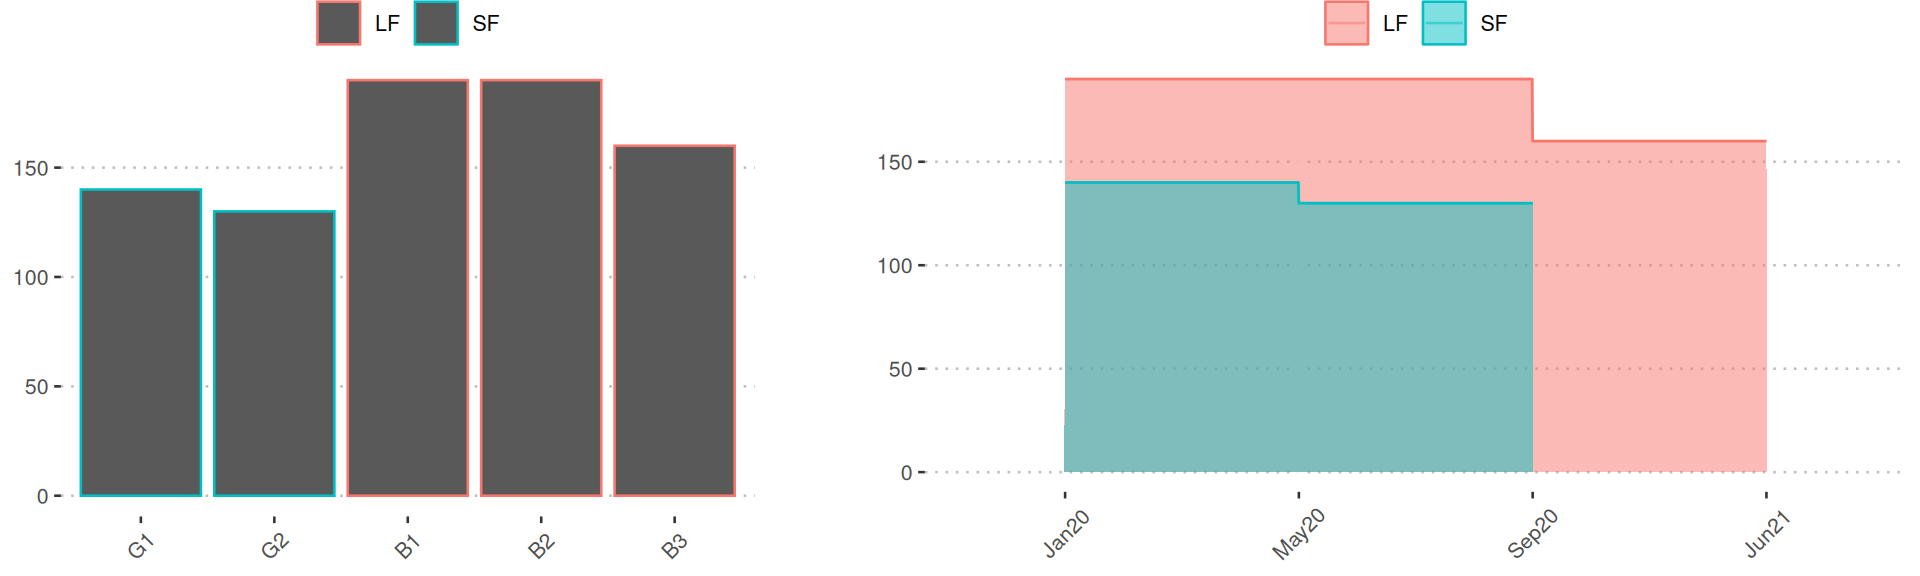
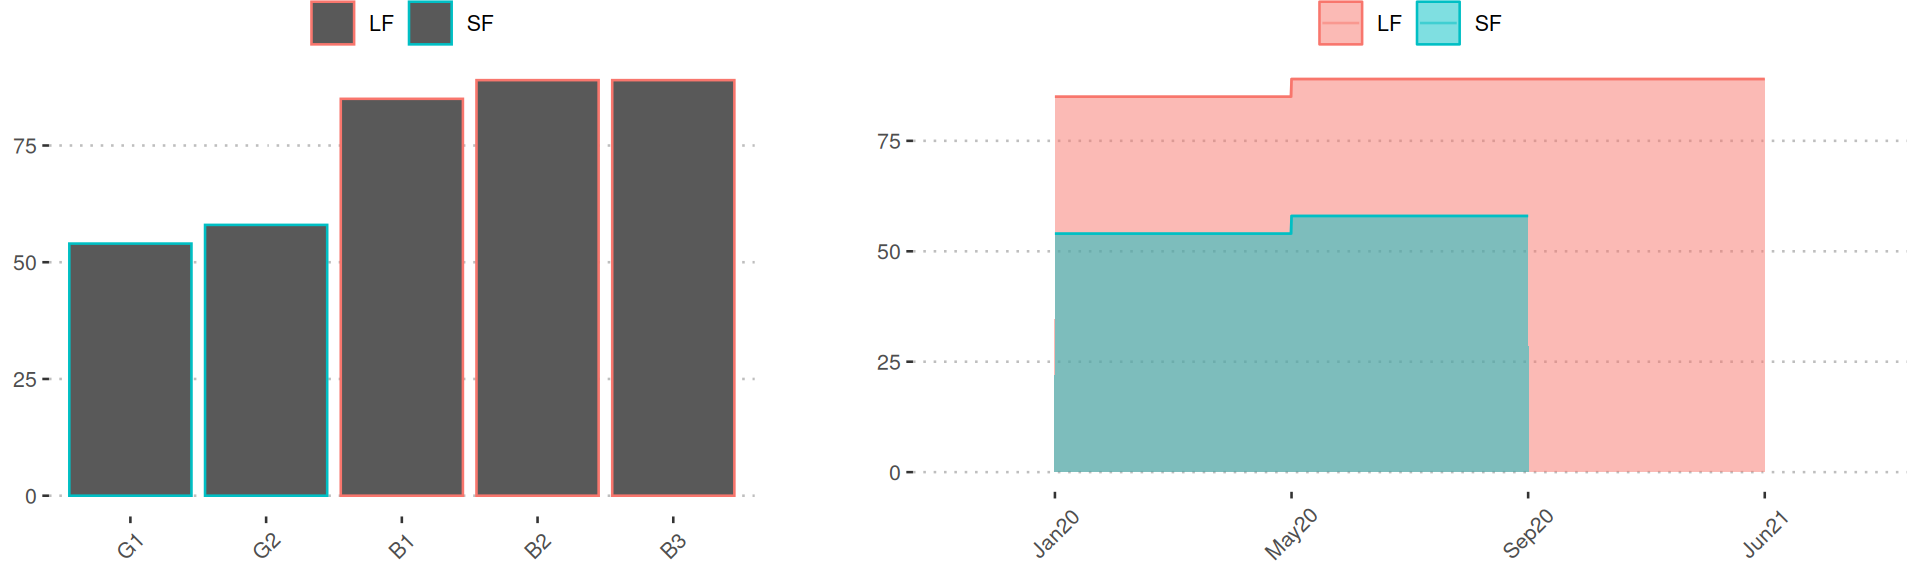
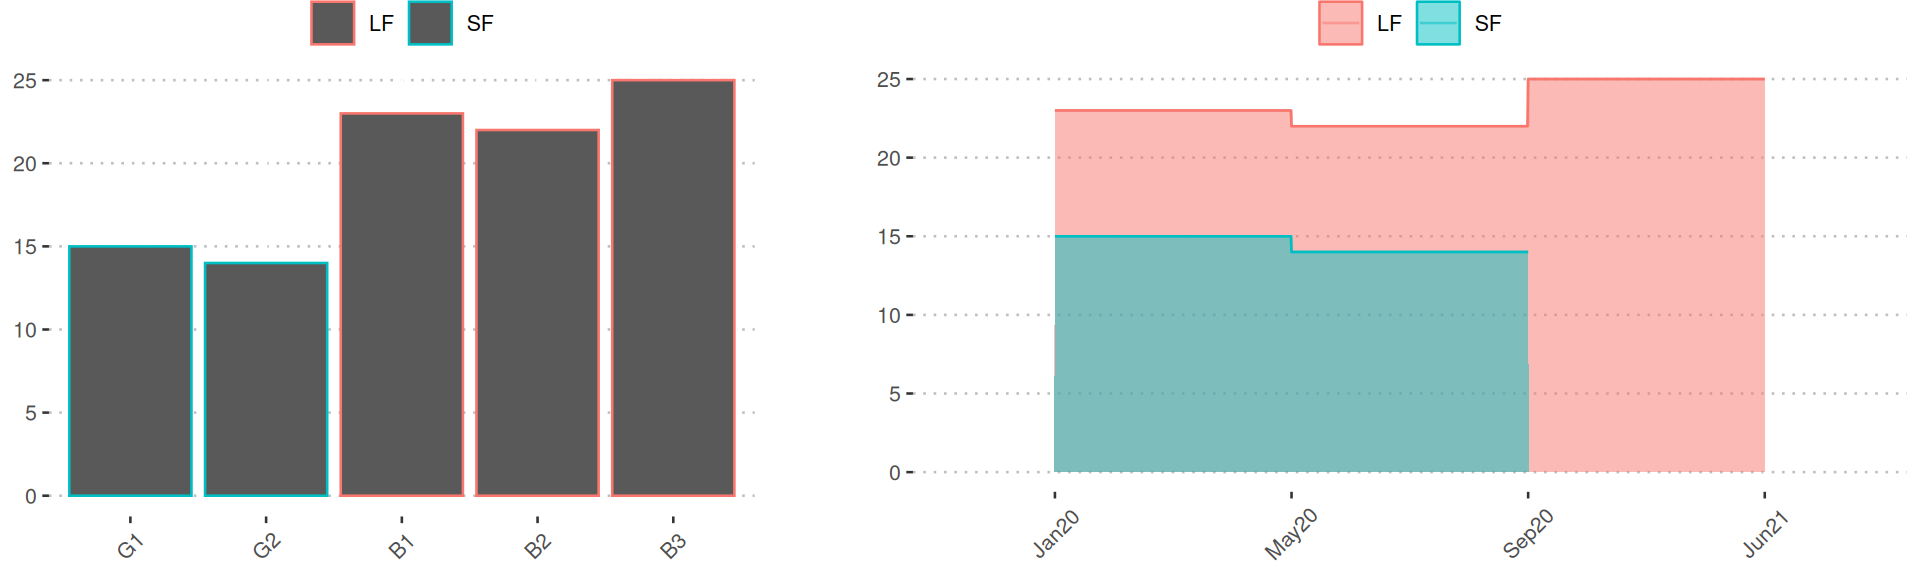
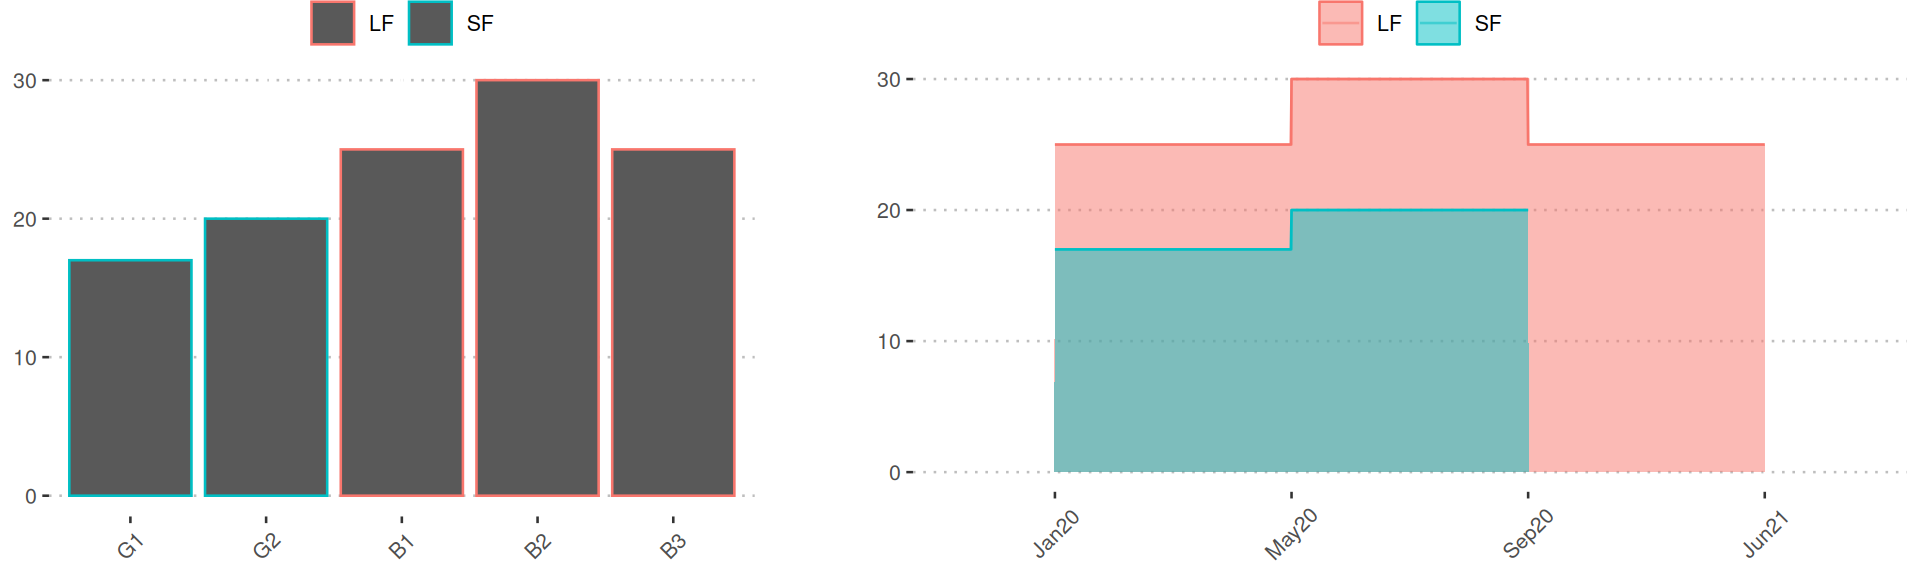
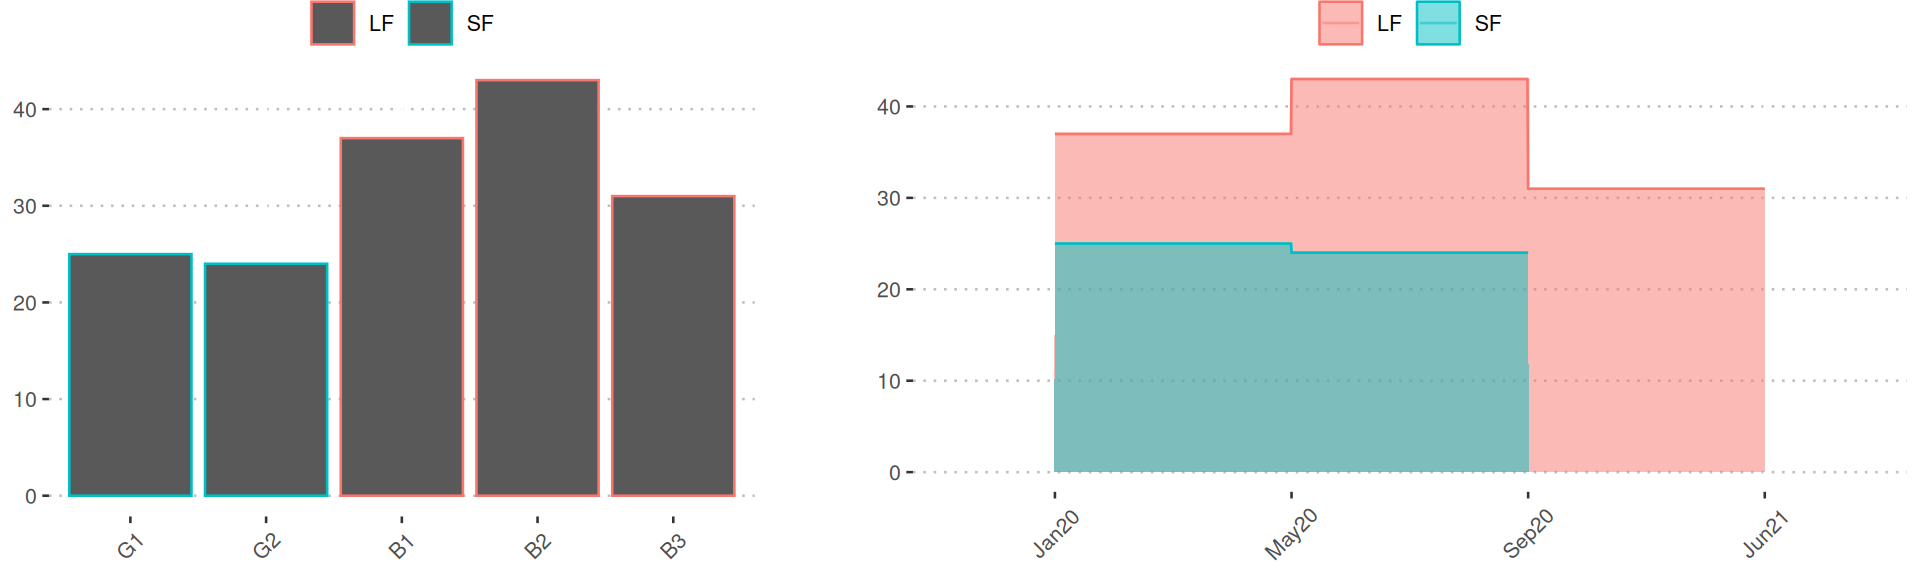
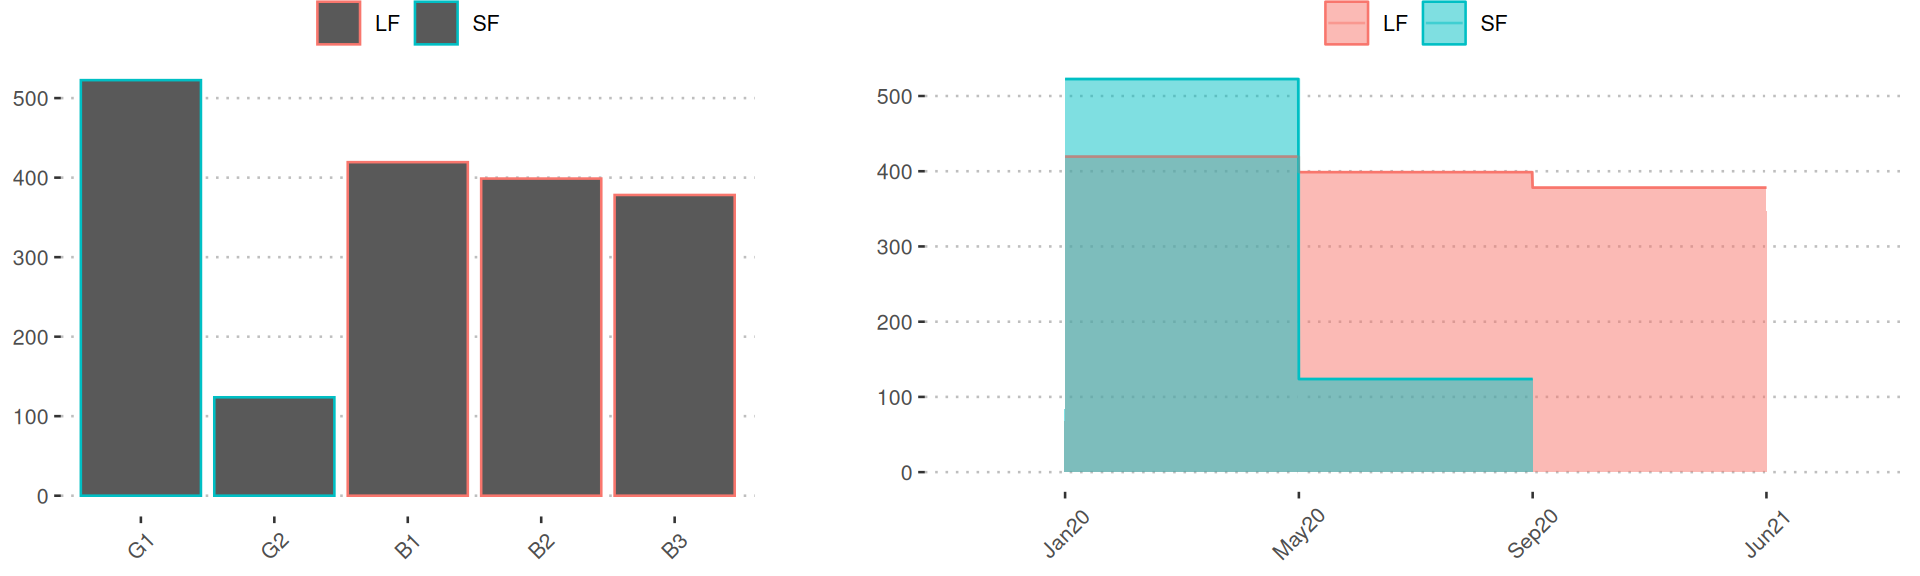
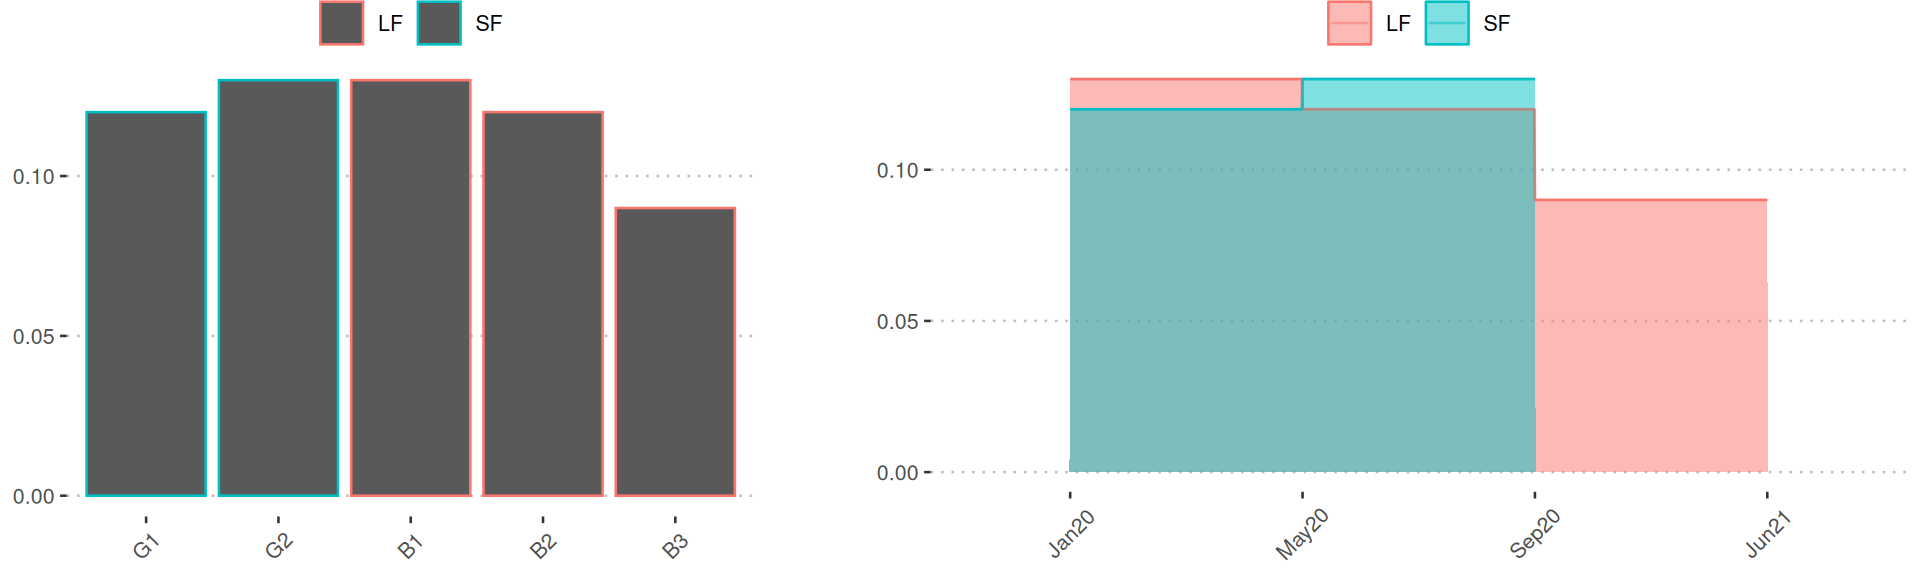
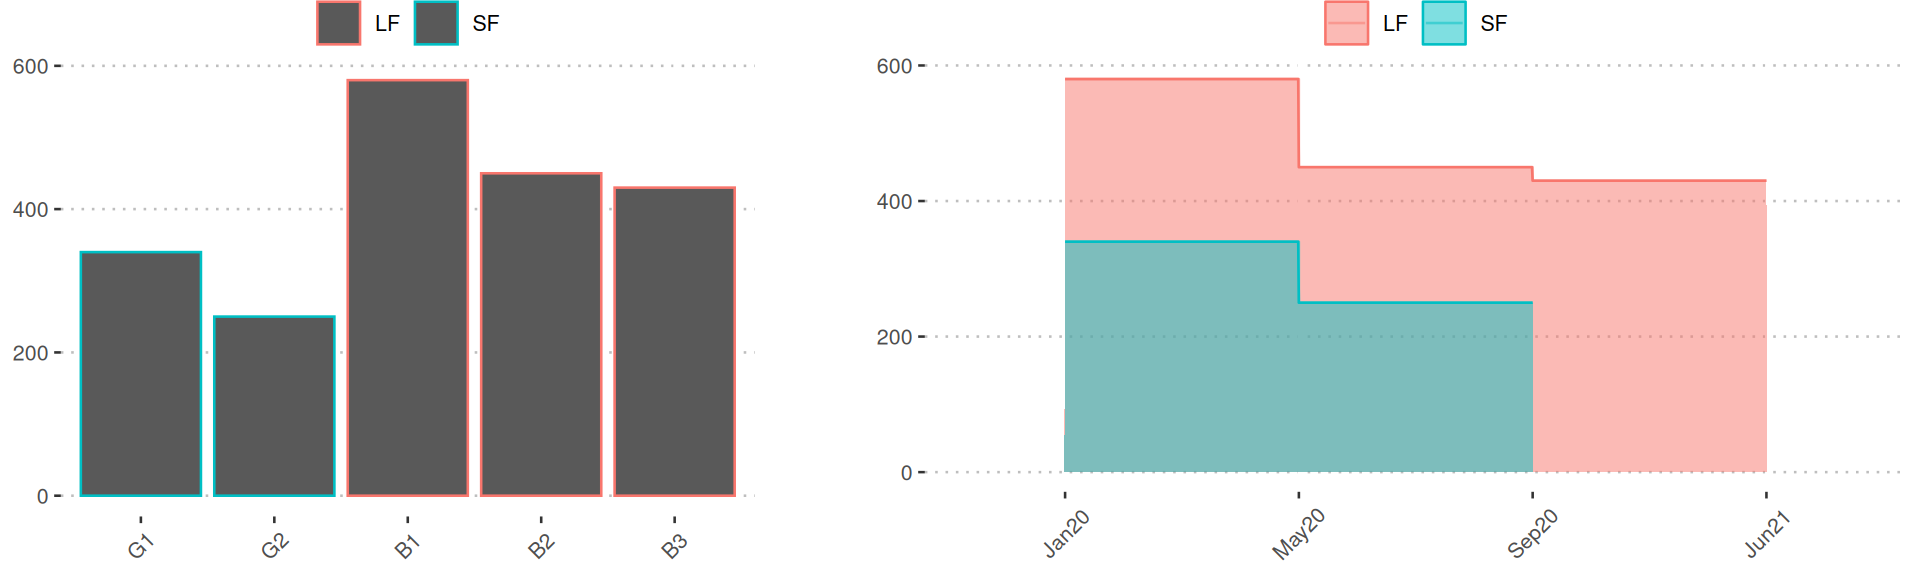
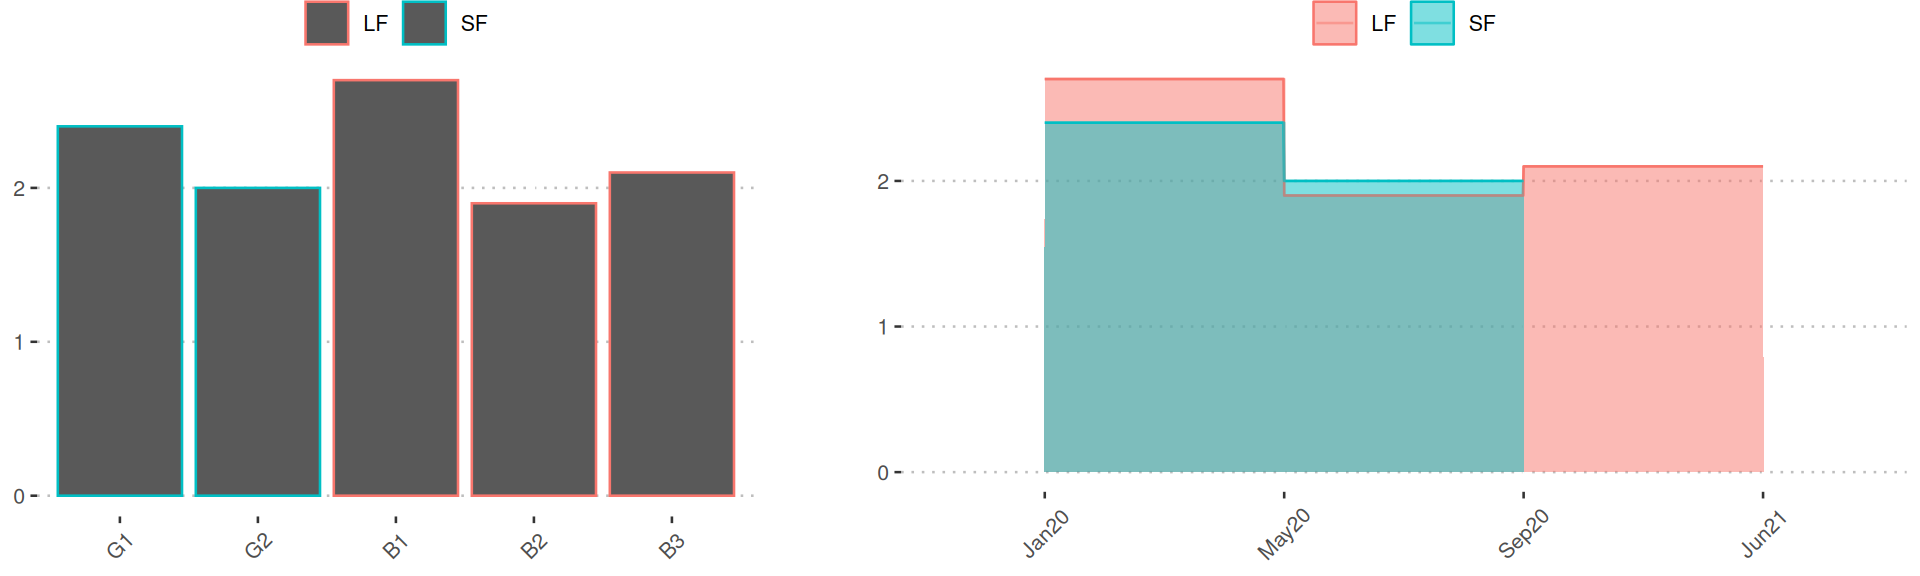
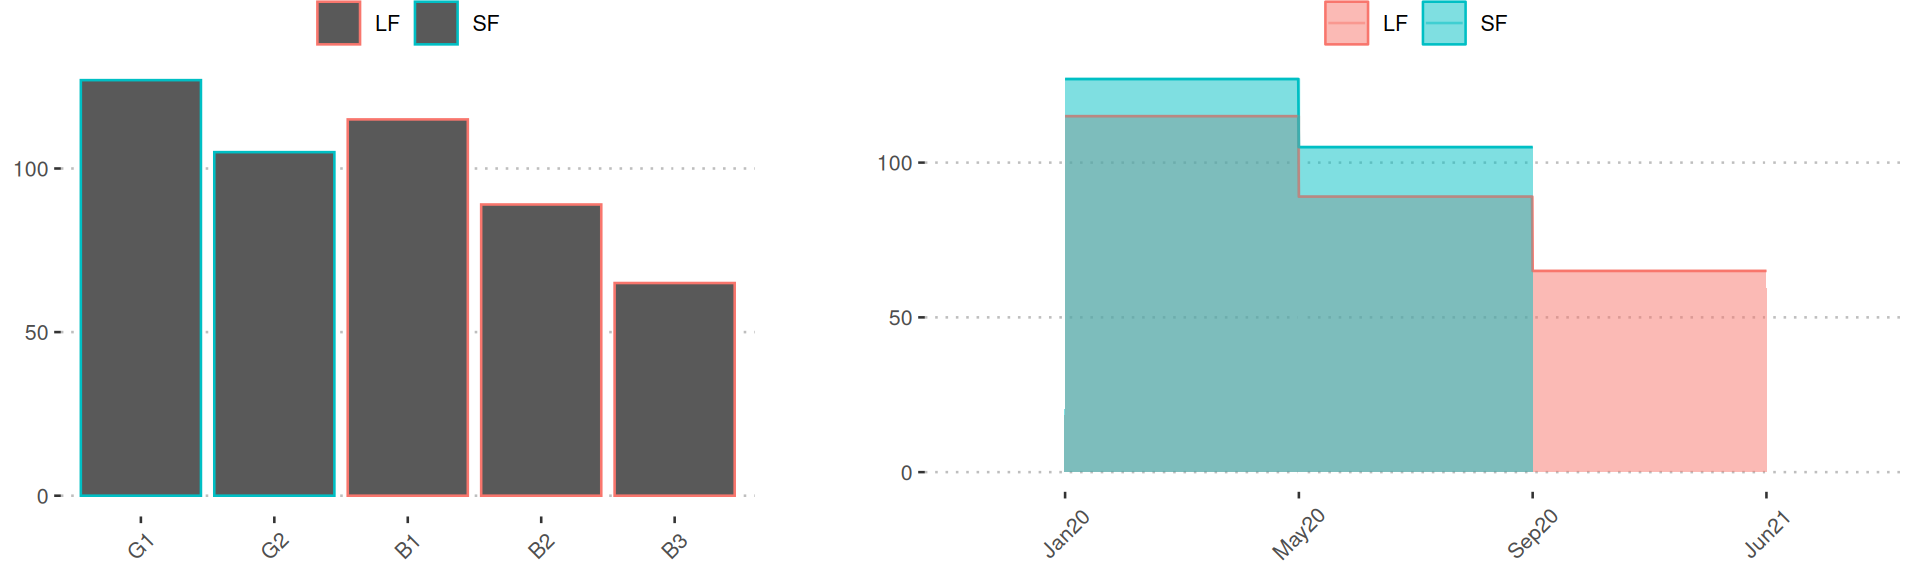
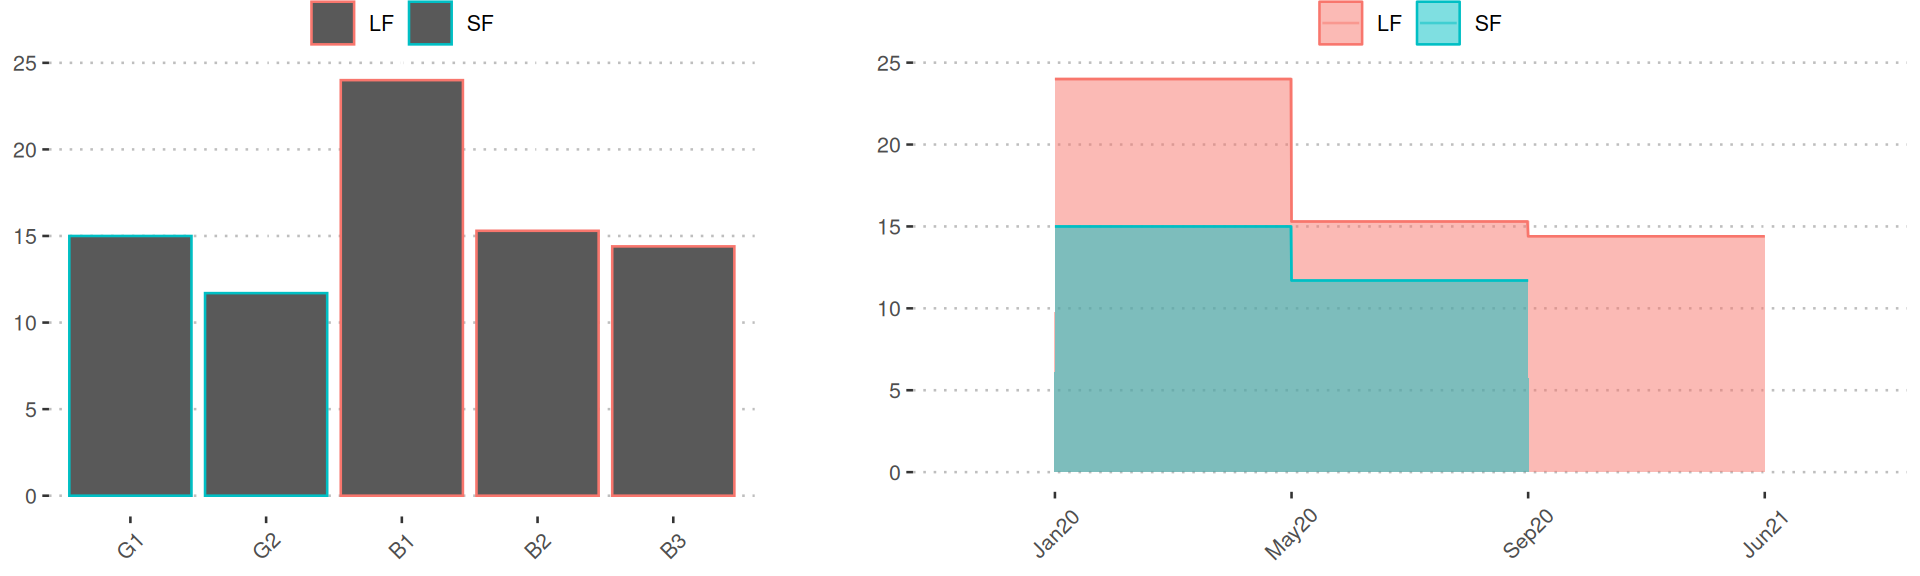
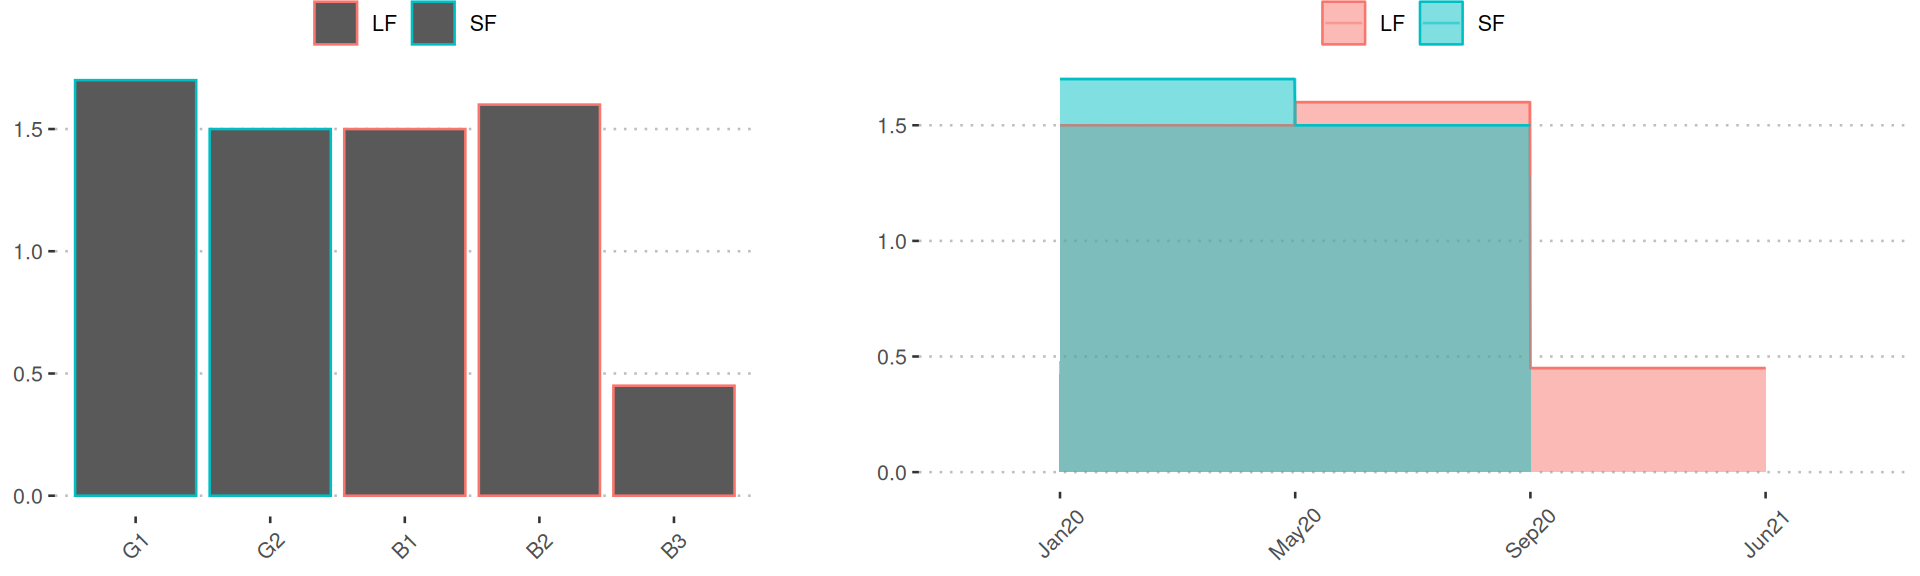
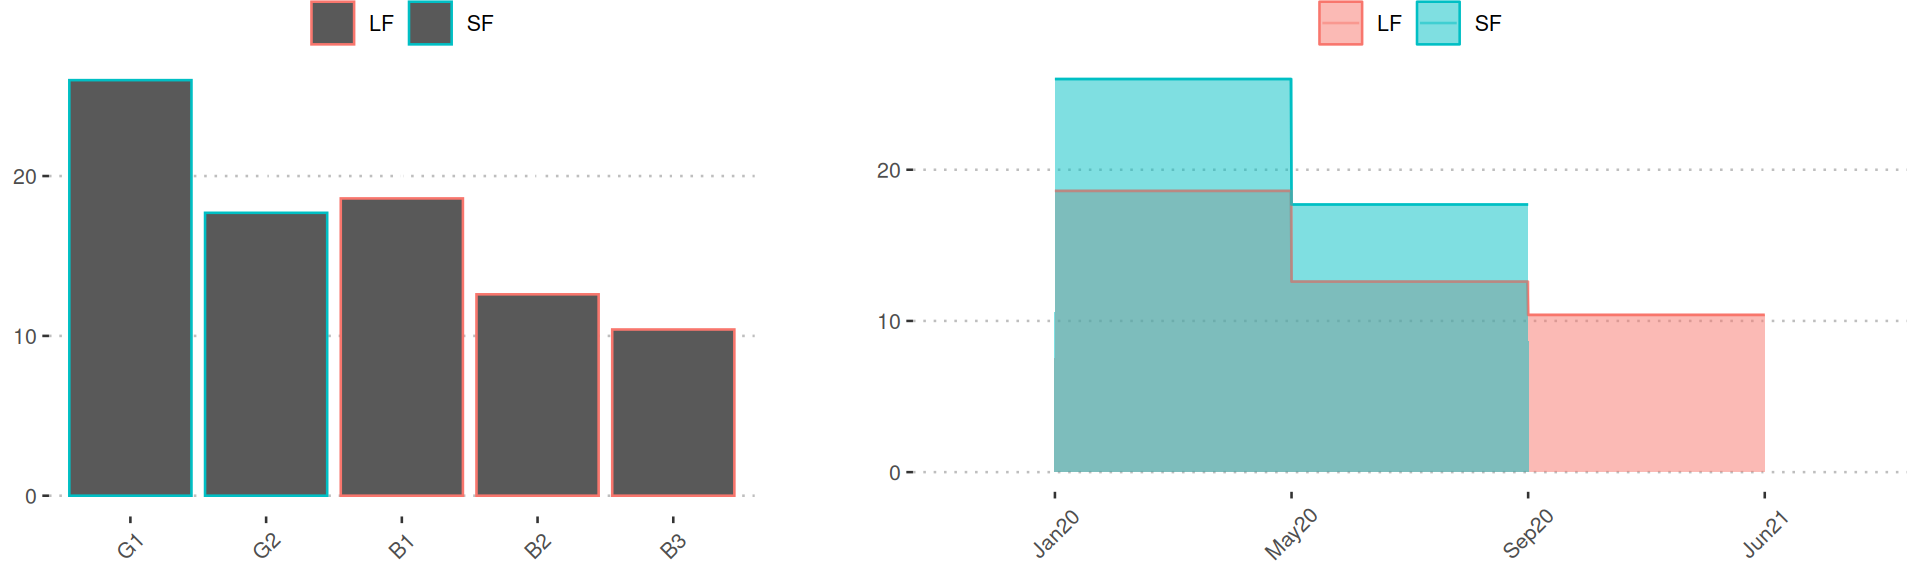
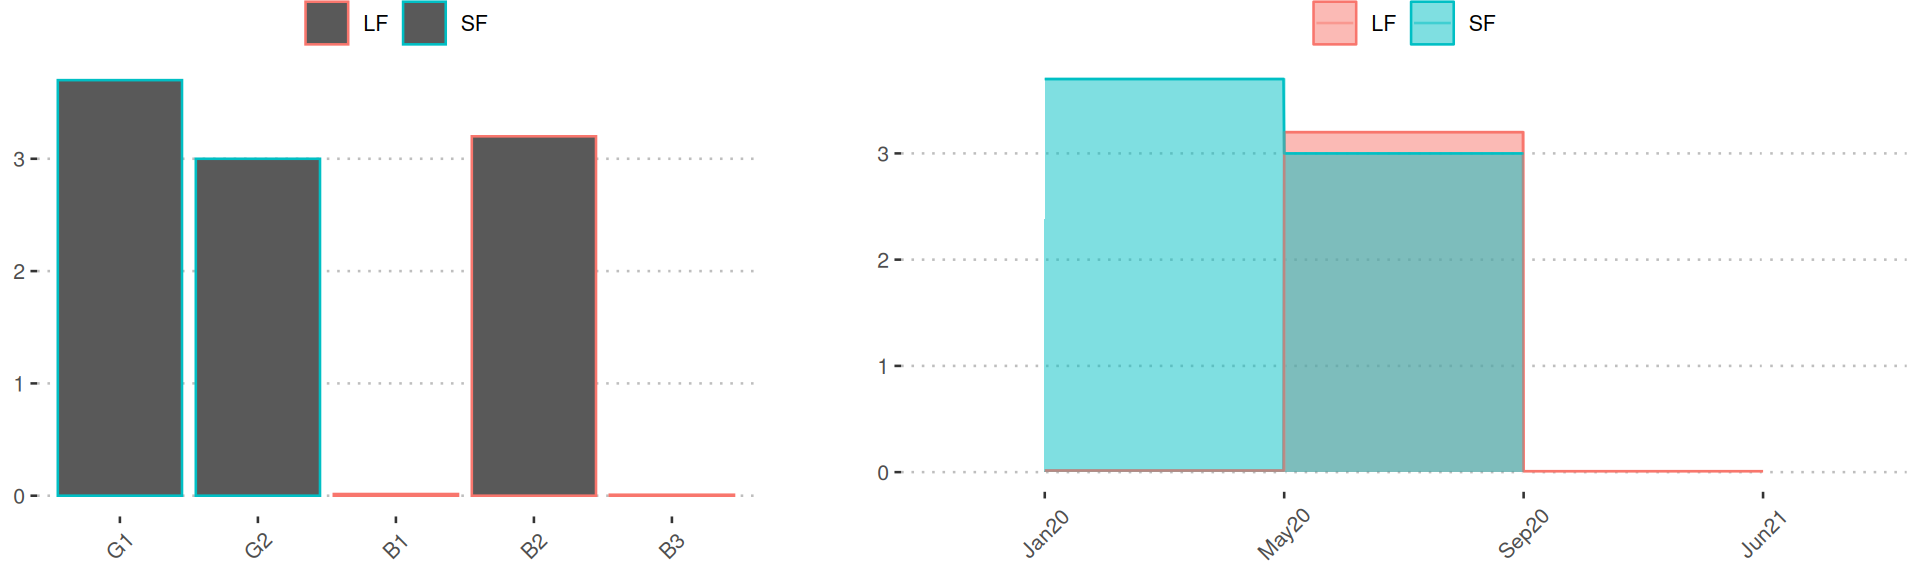
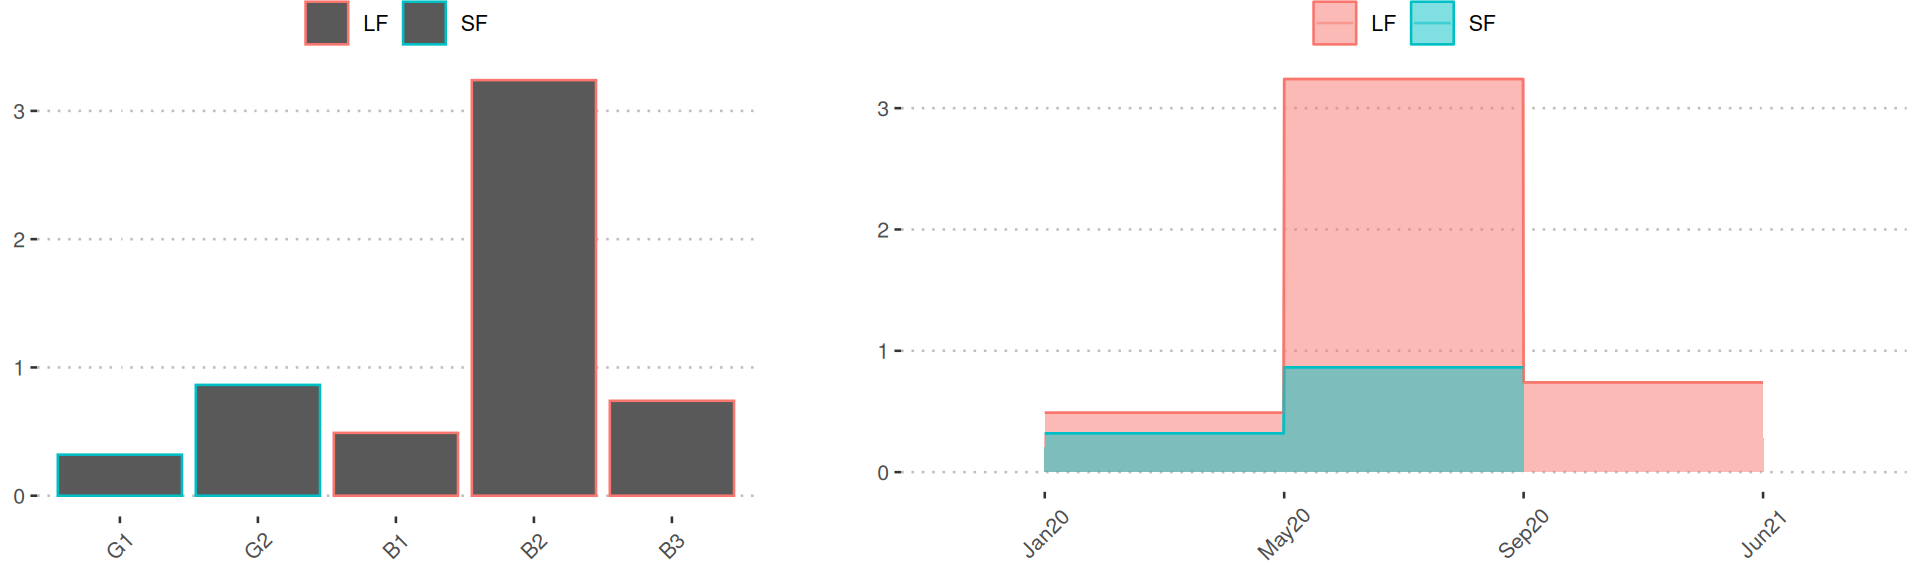
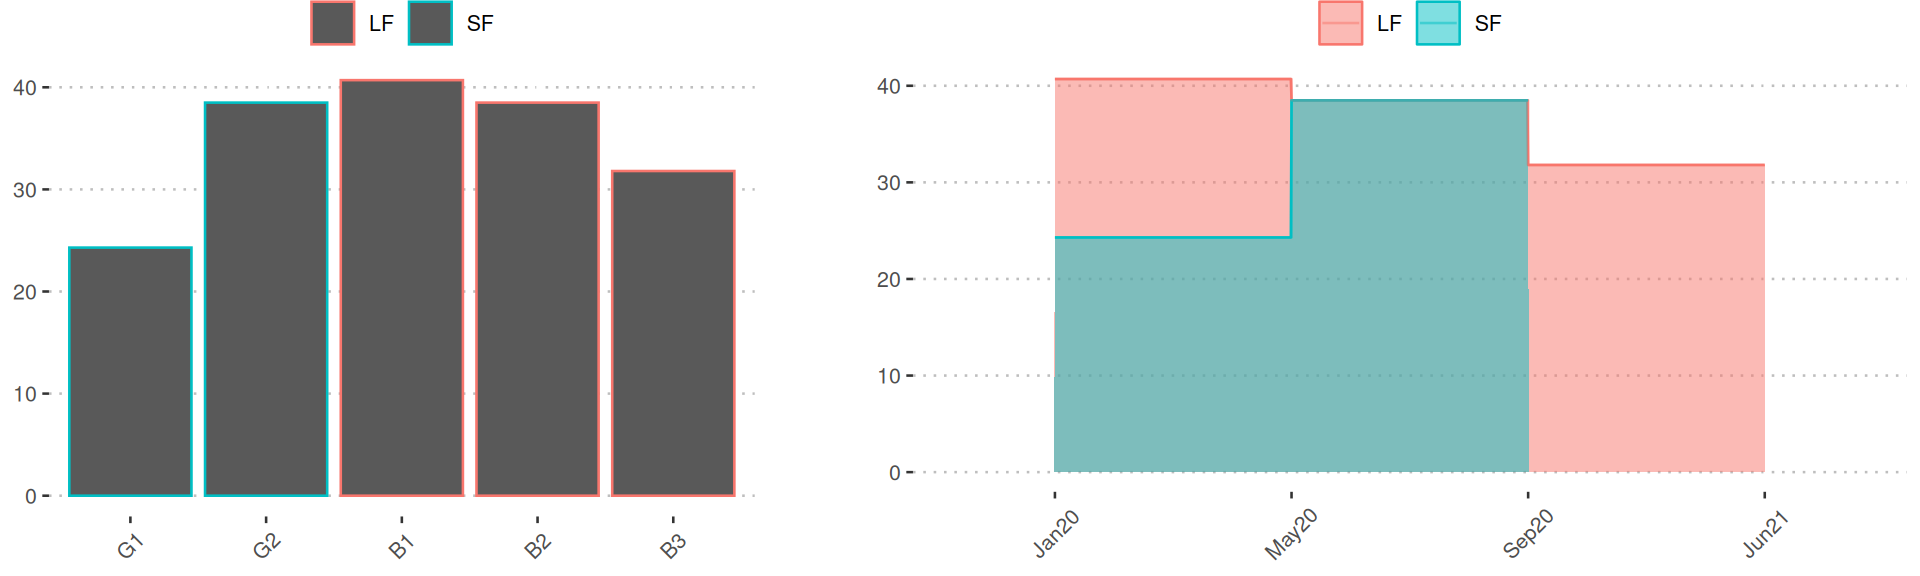
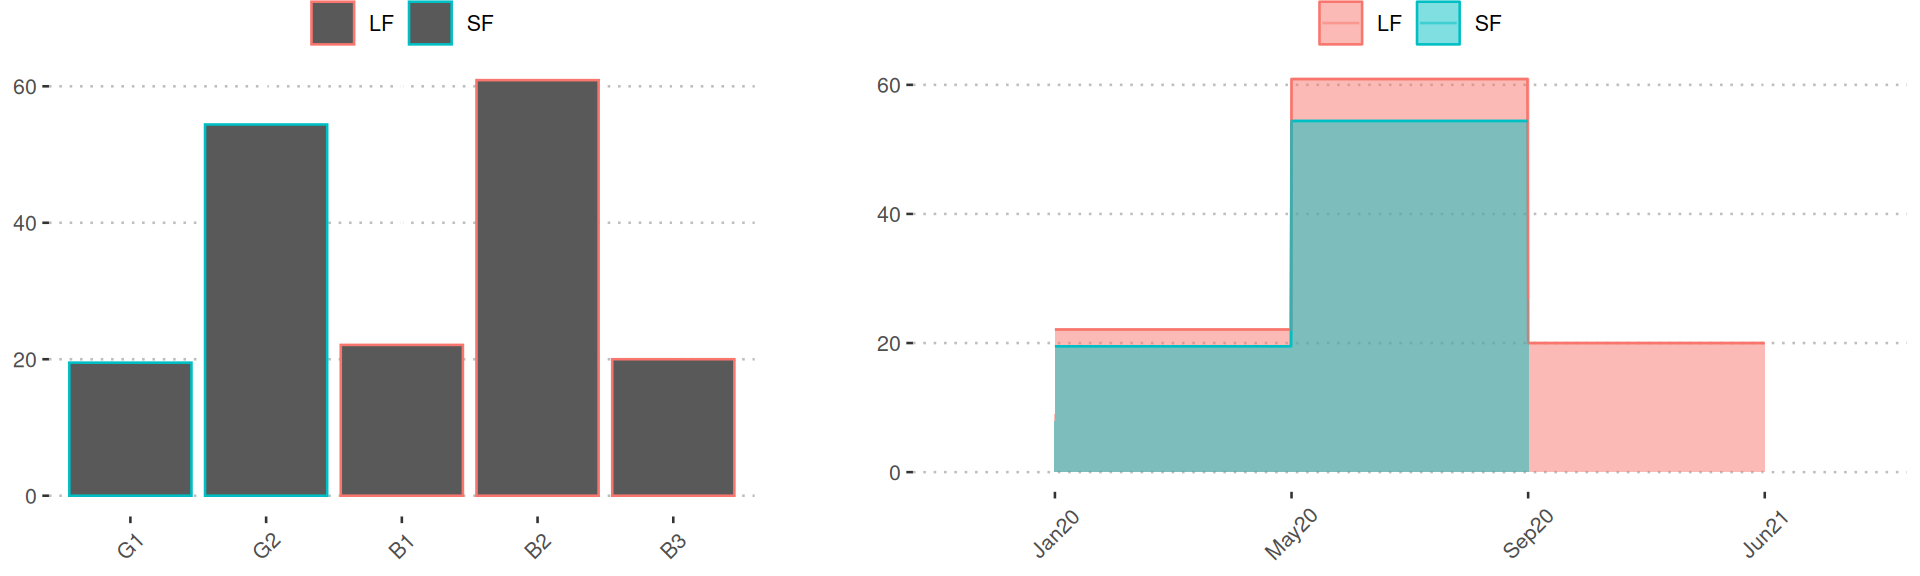
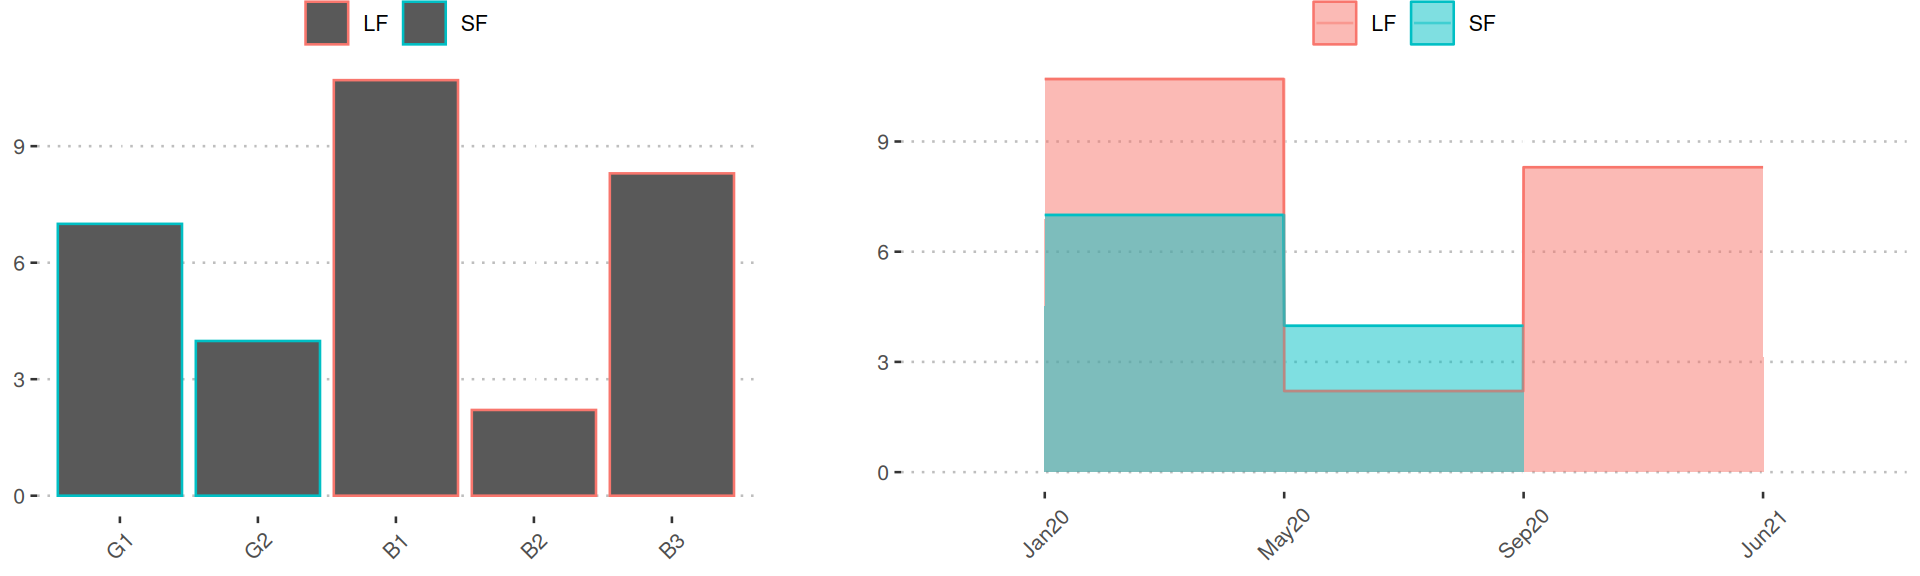
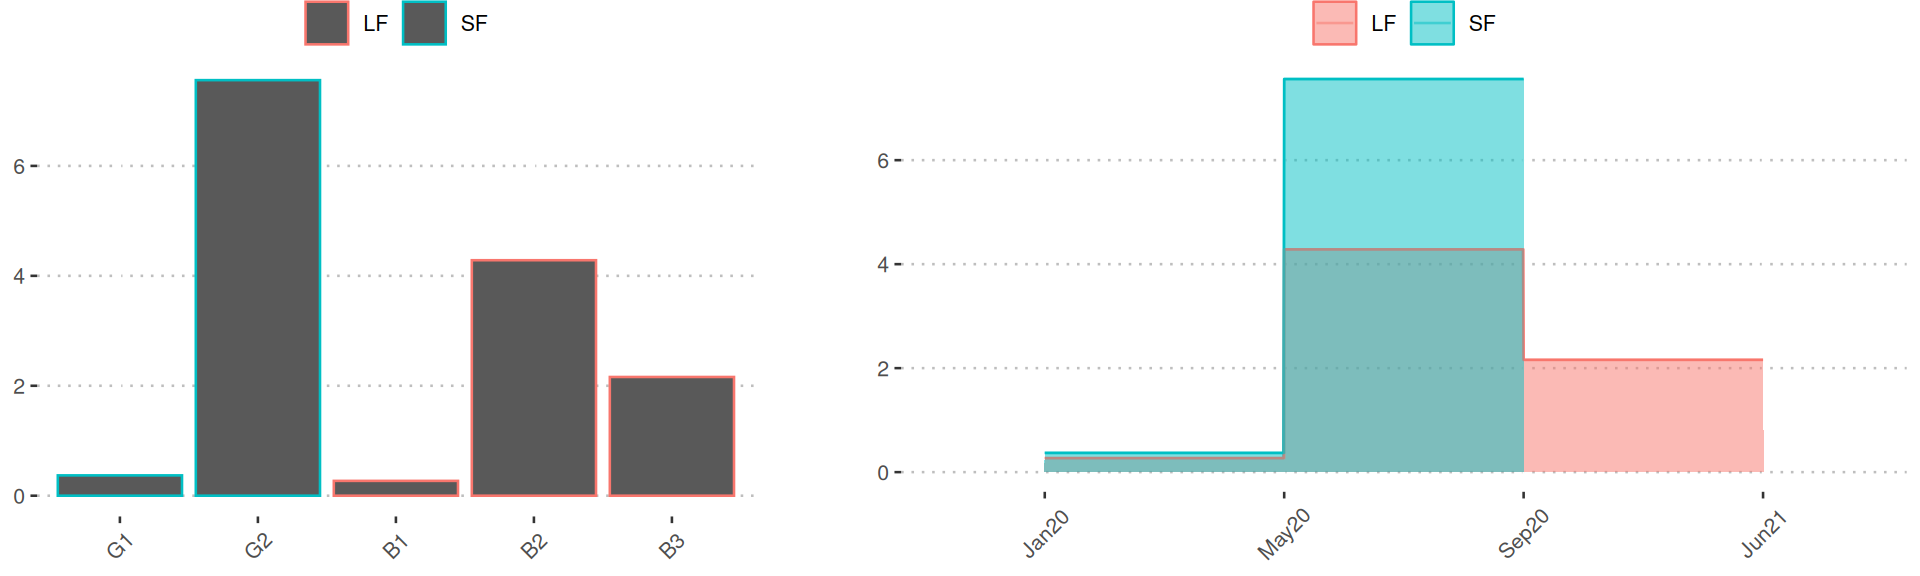
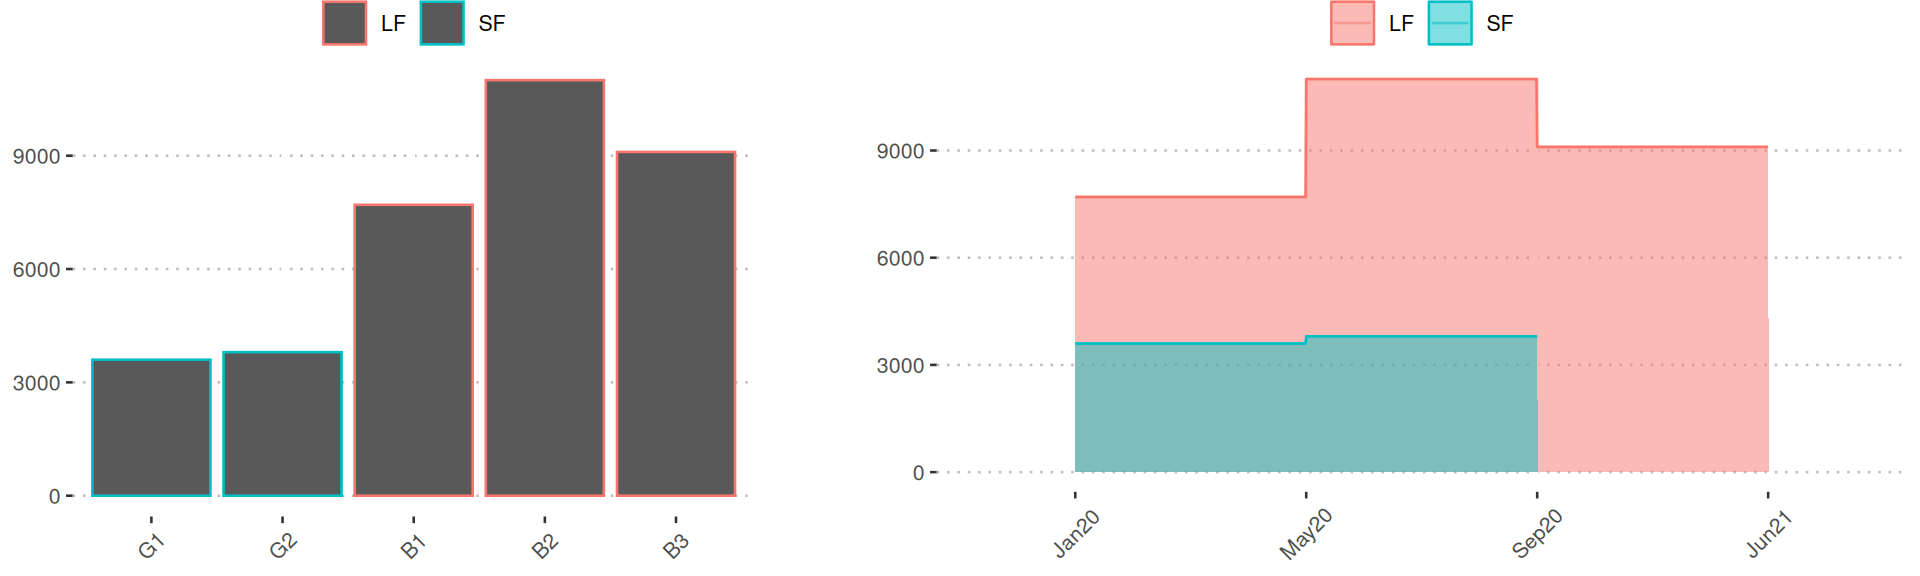
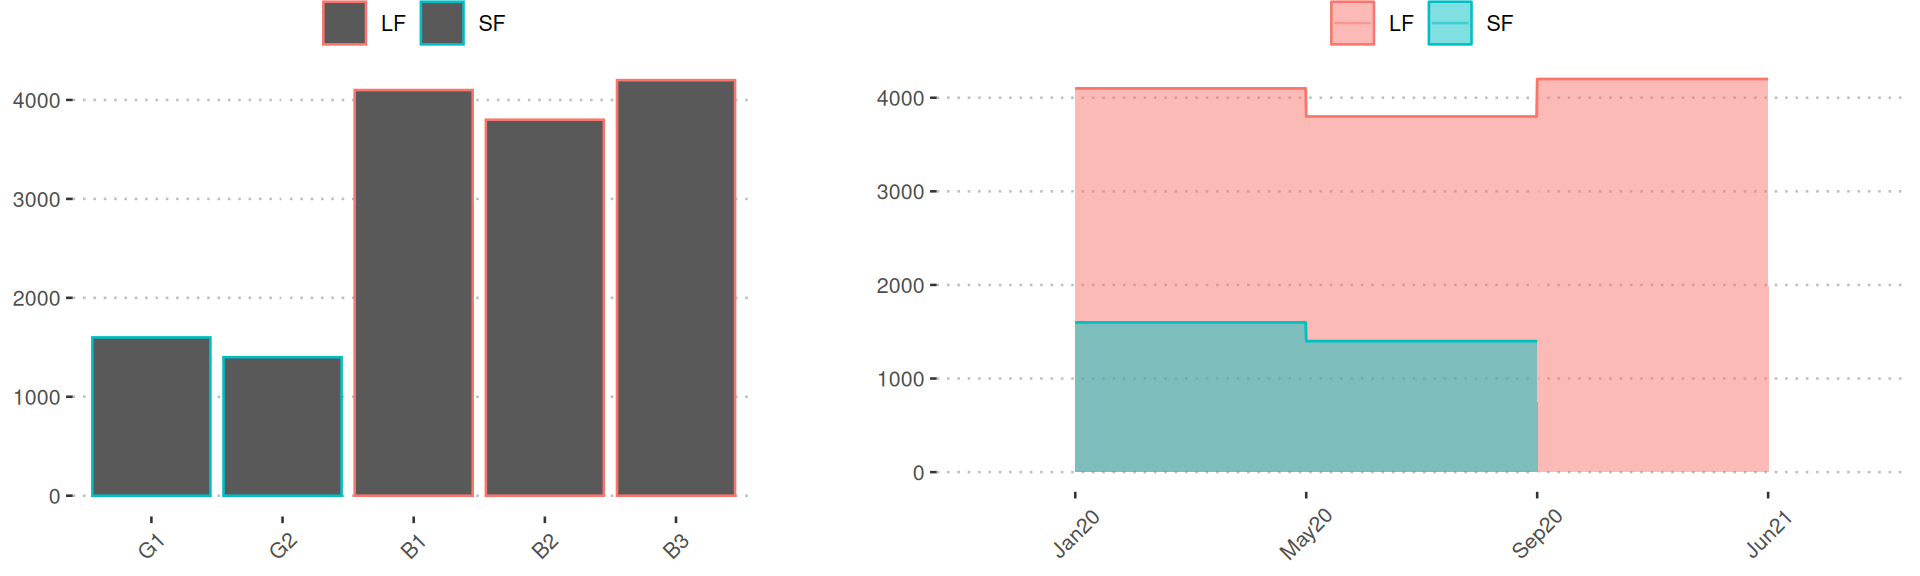
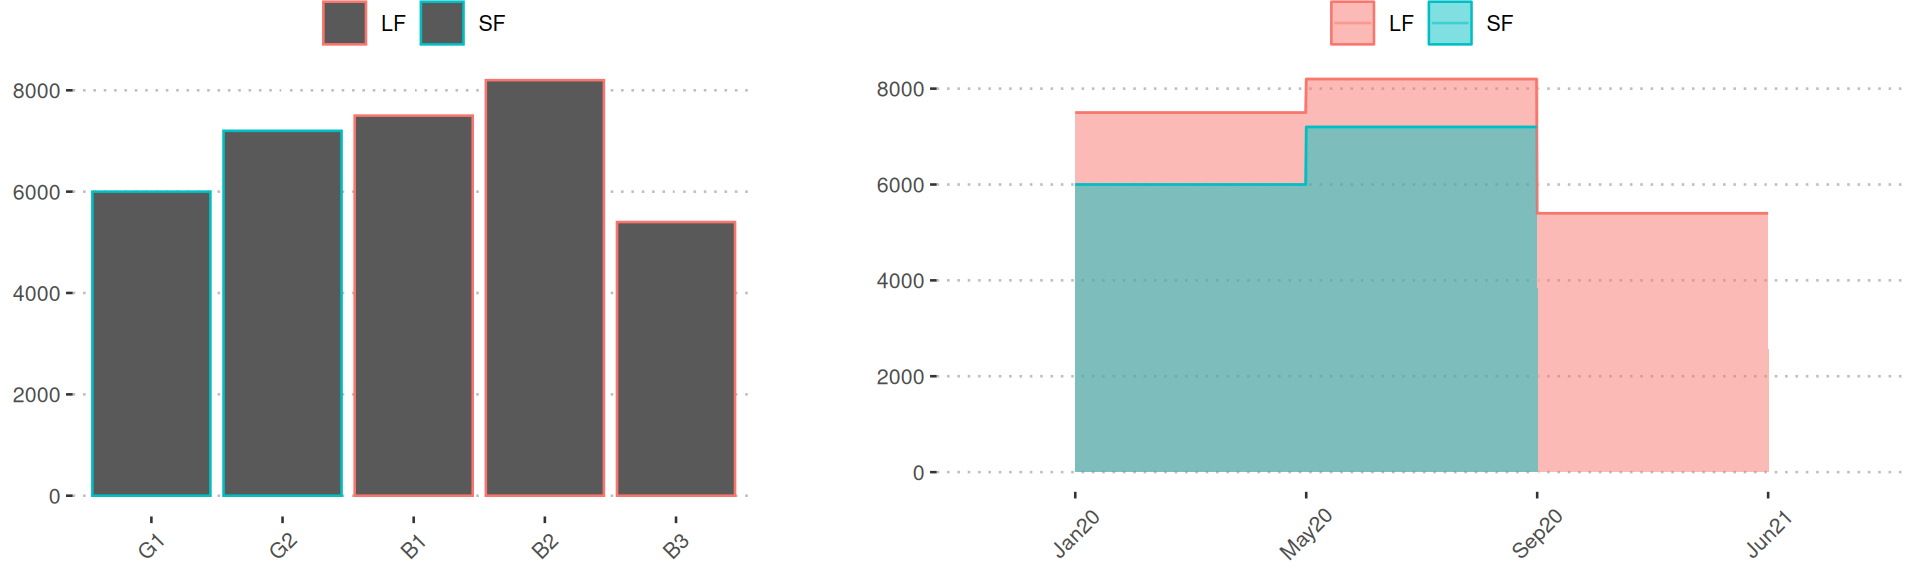
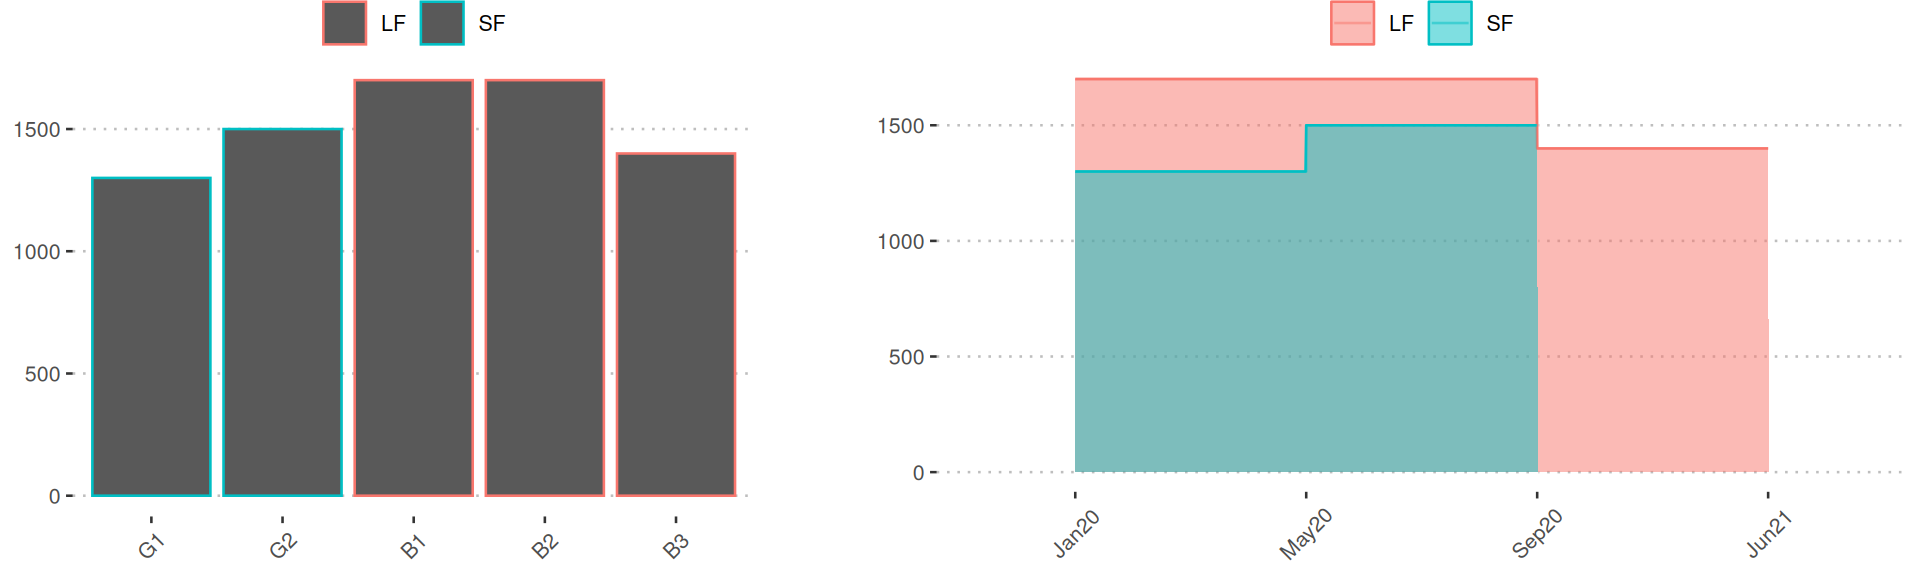
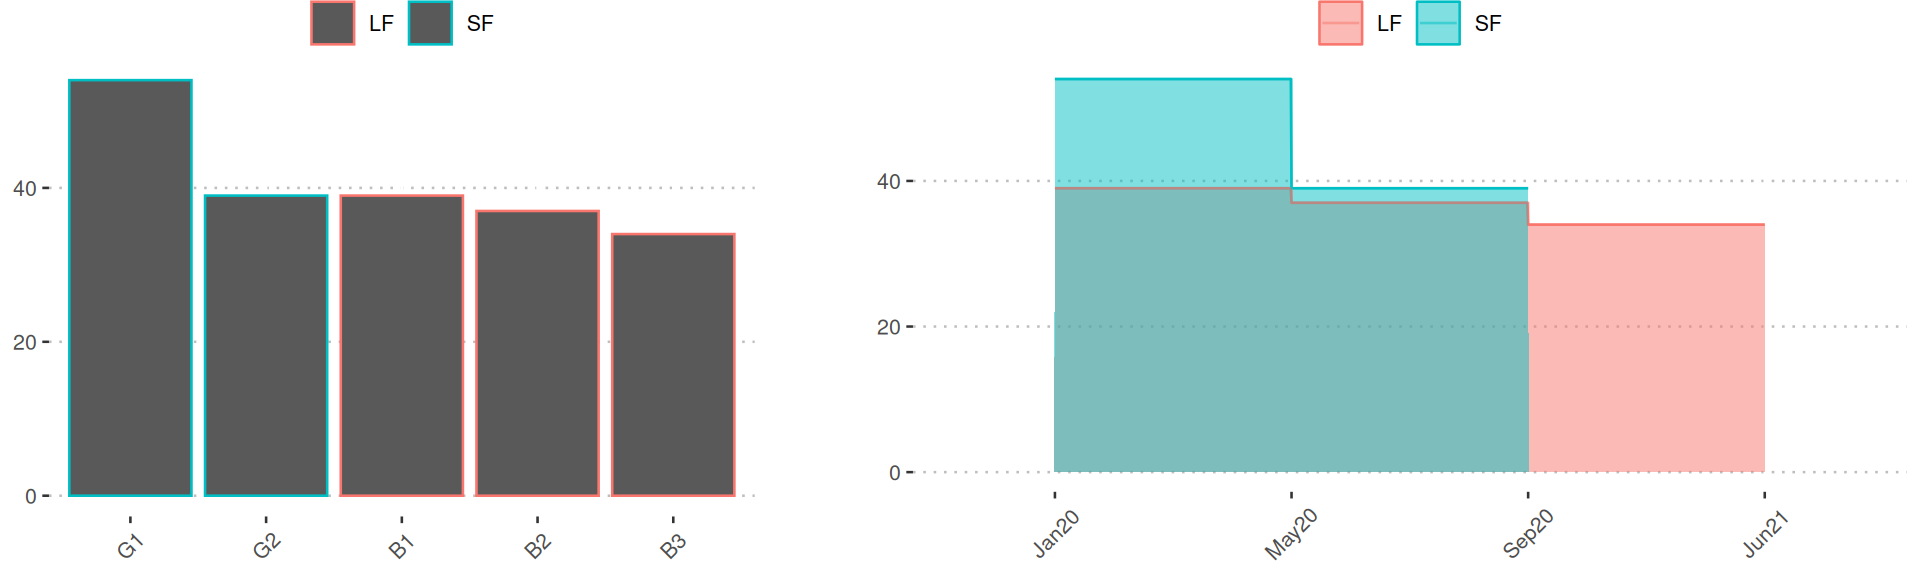
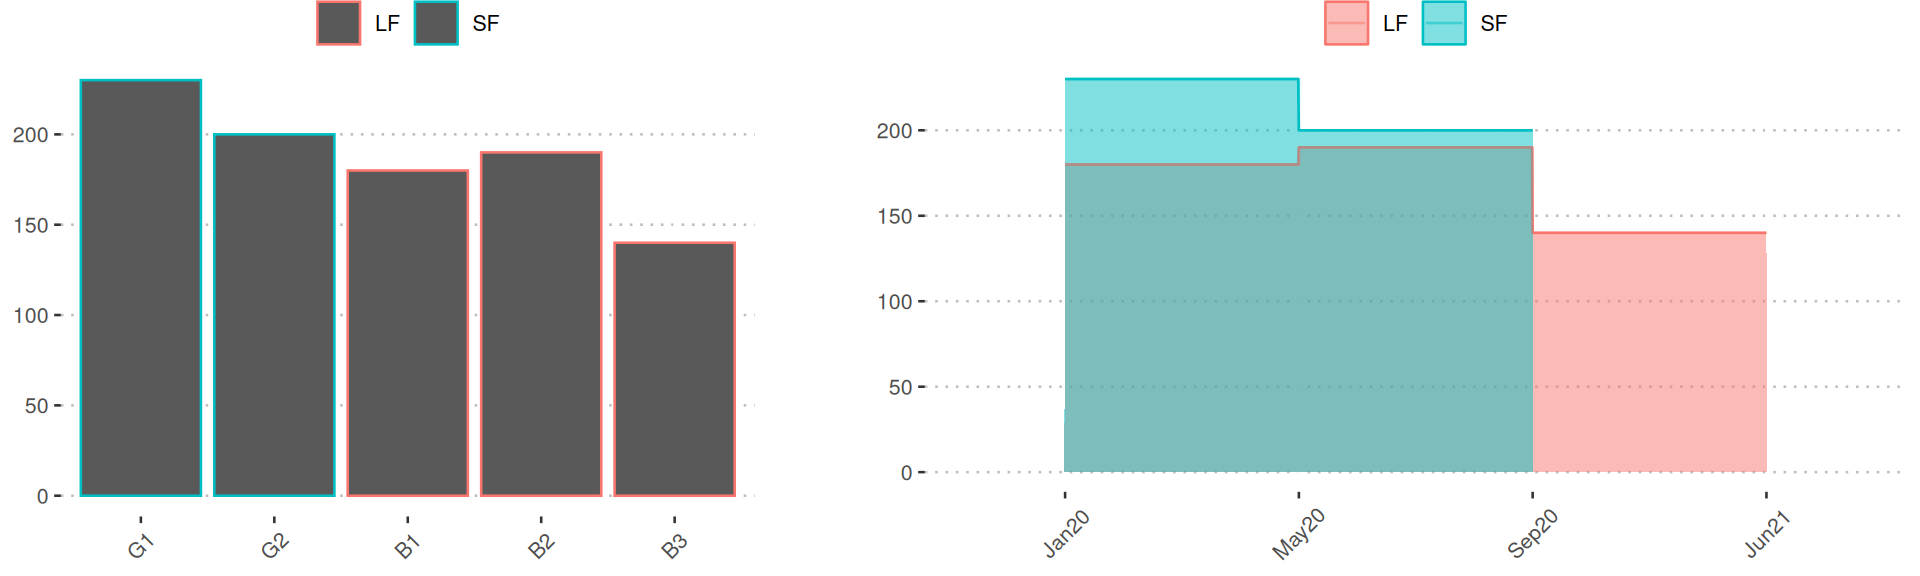
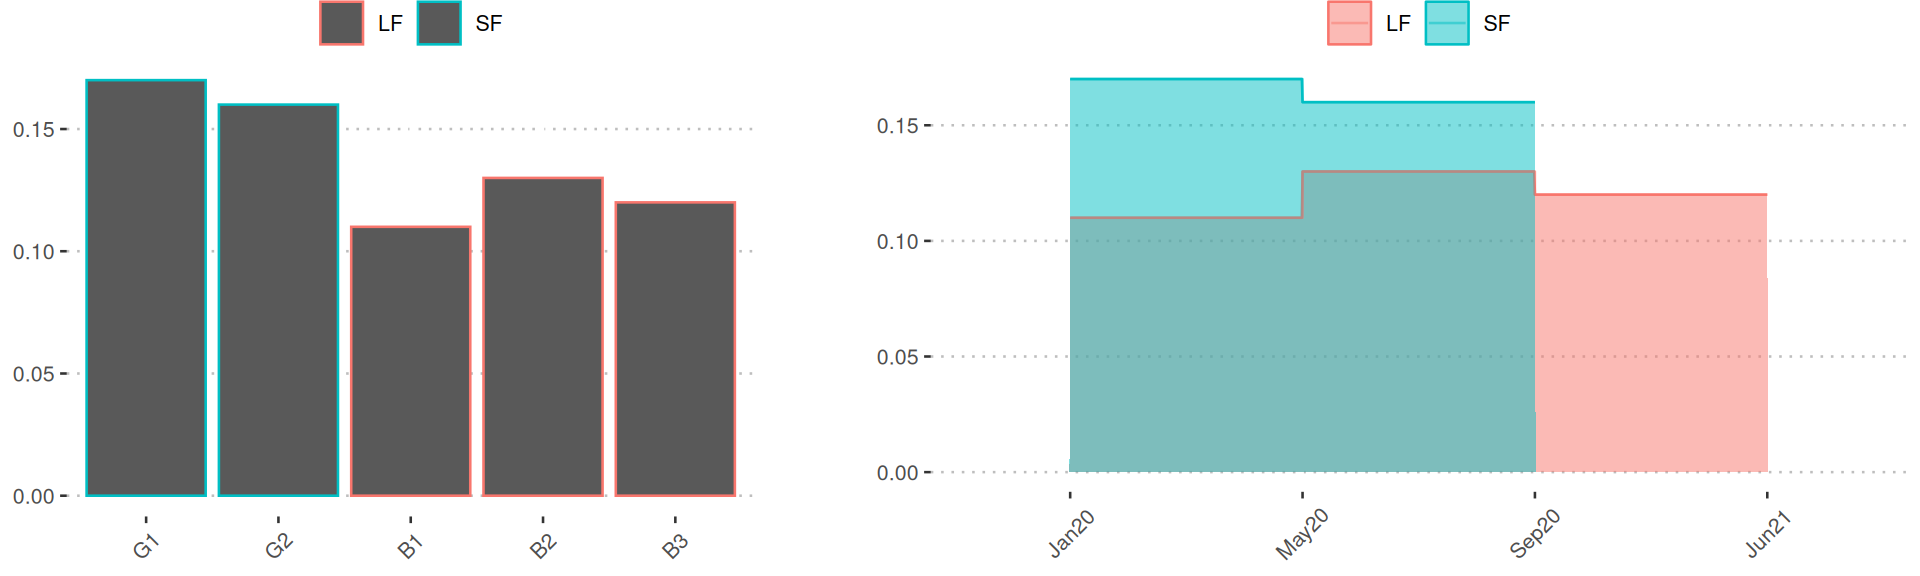
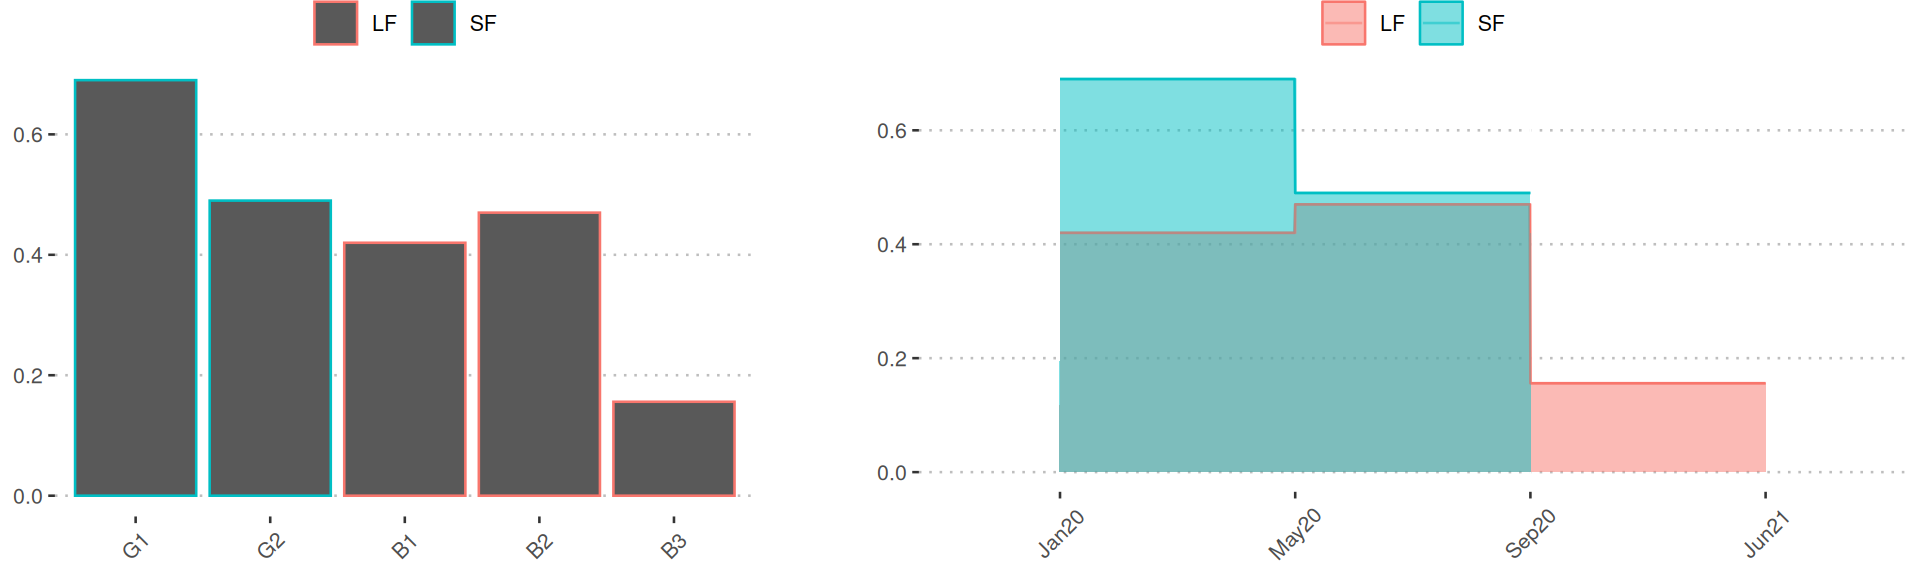
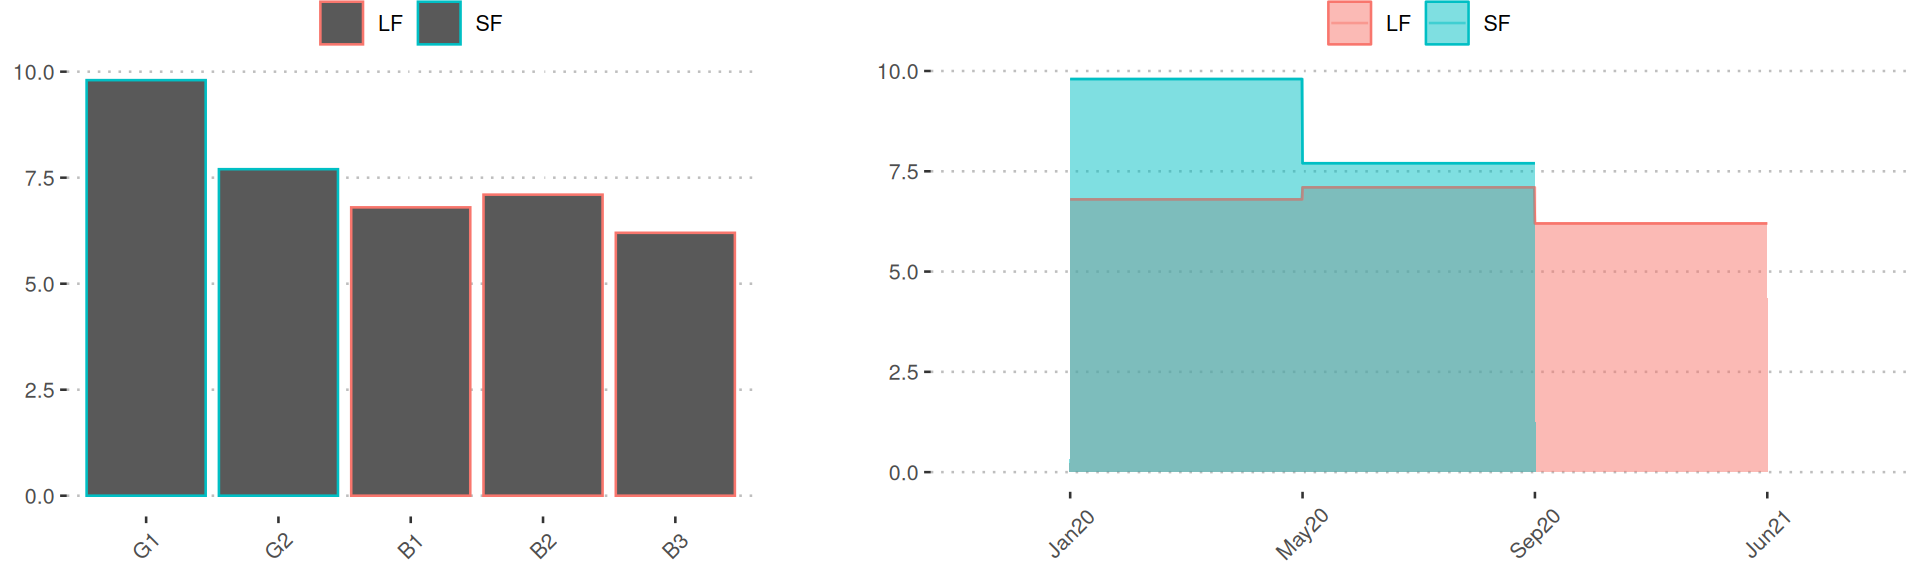
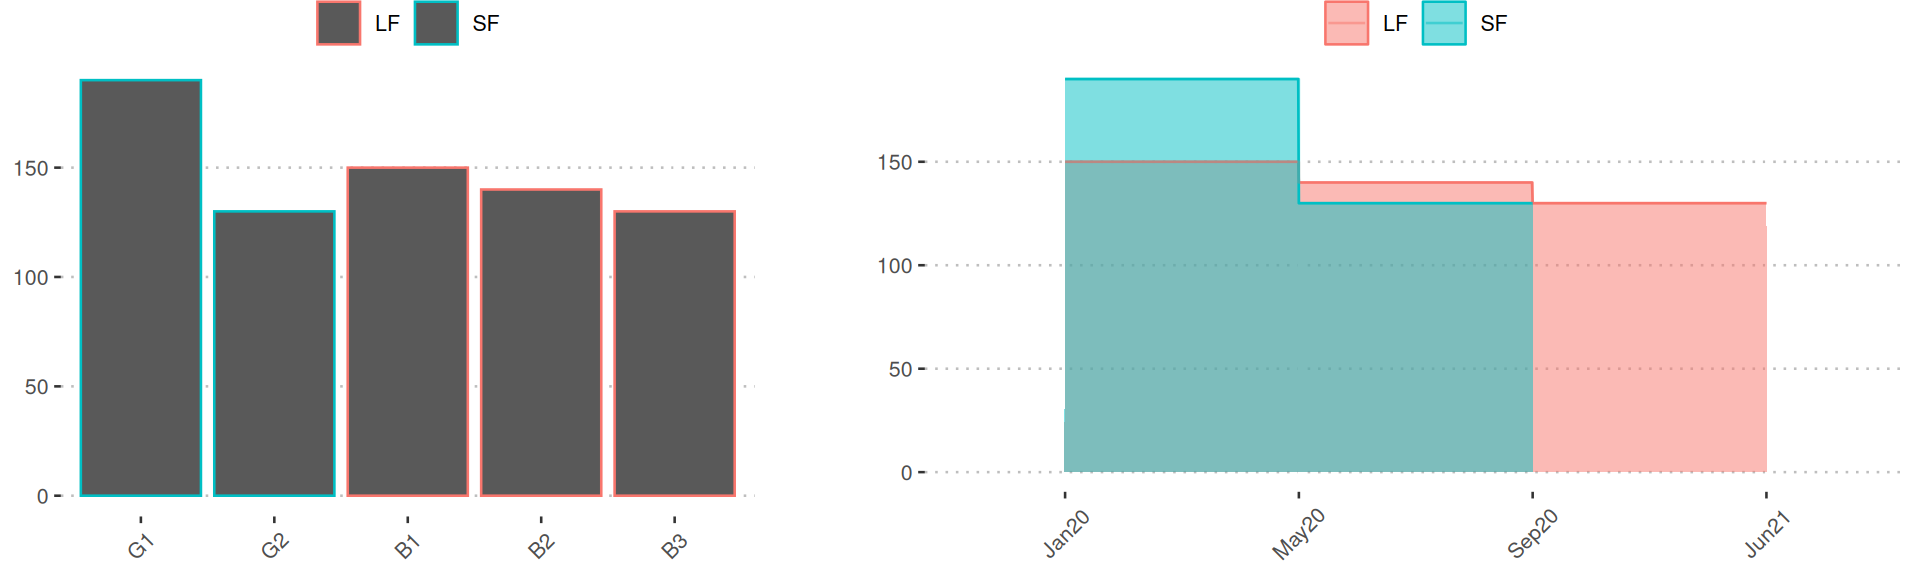
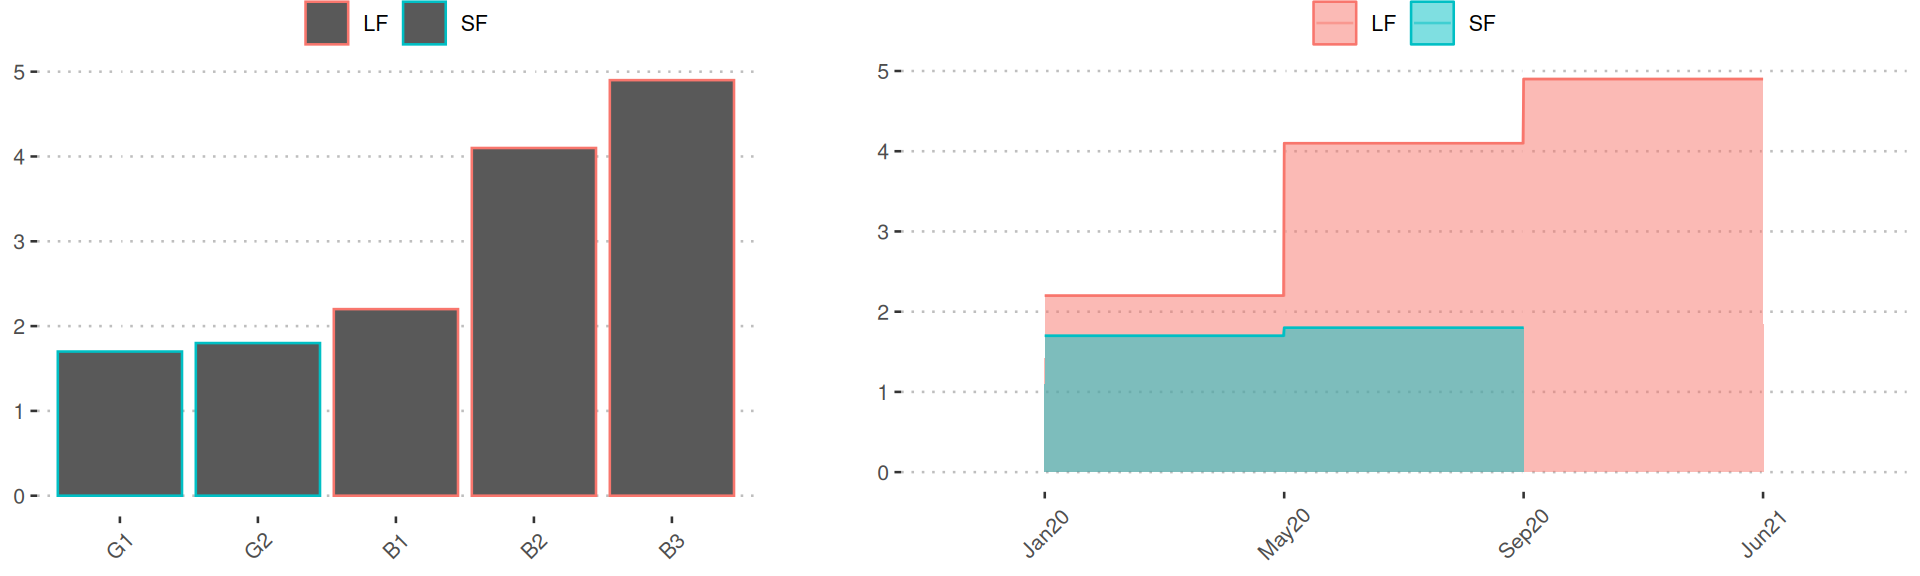
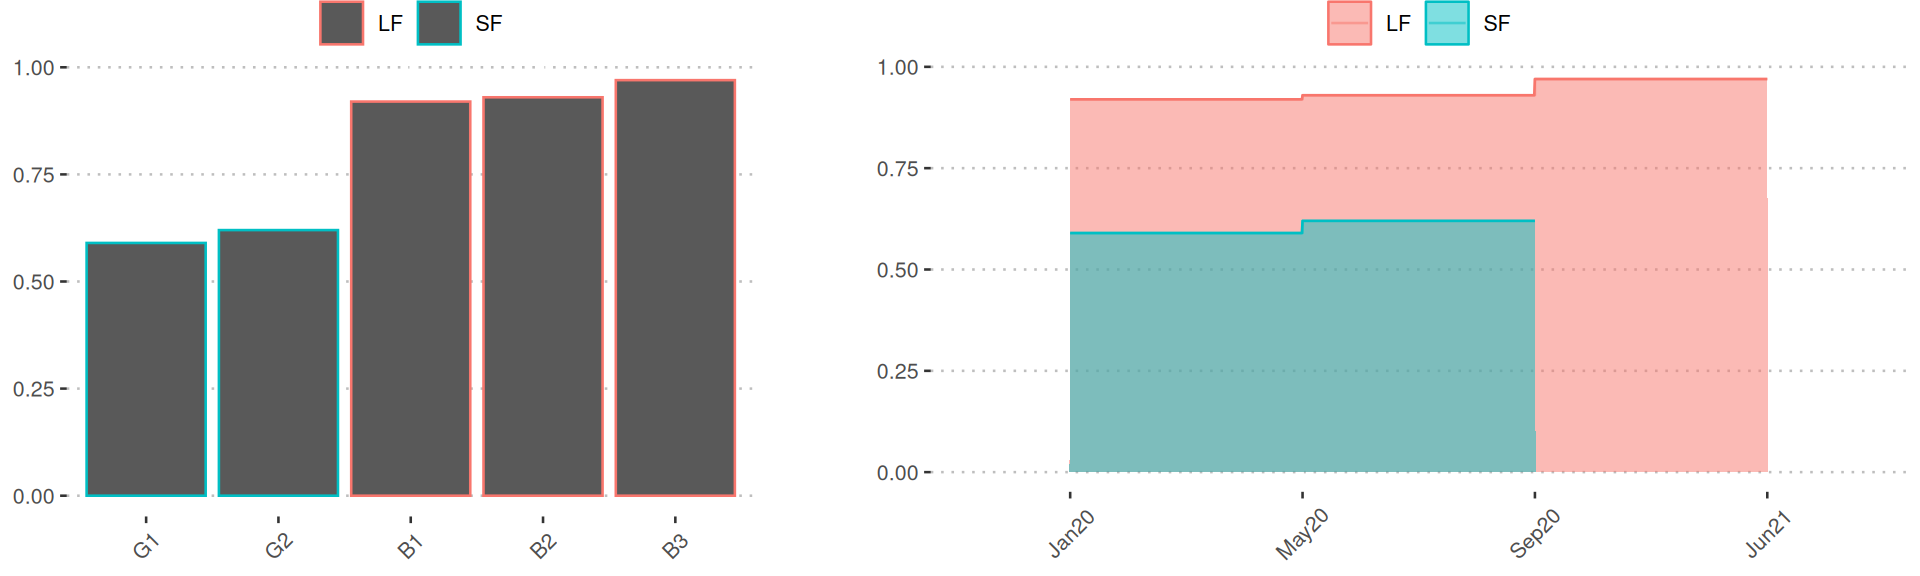
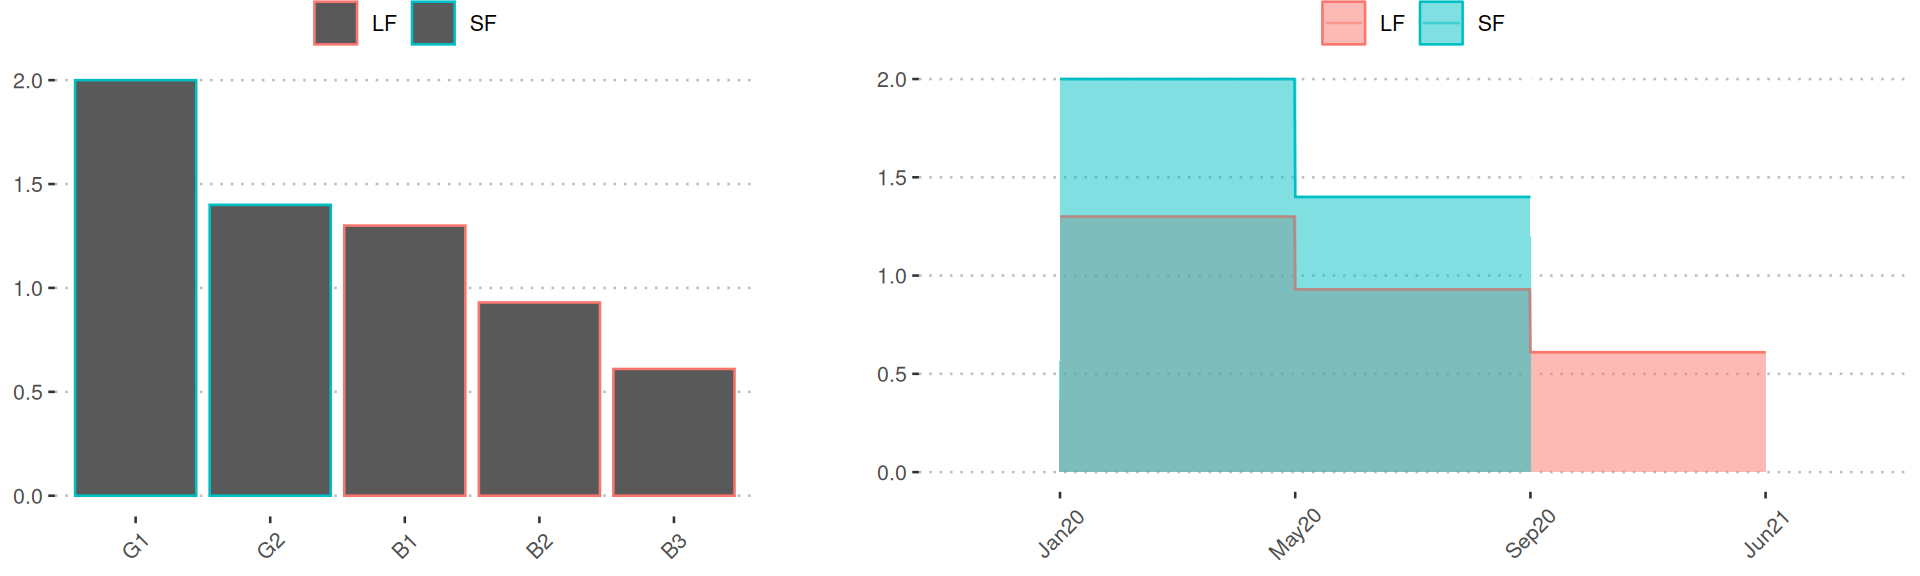
Two feed types; long-term feeding (LF) and short-term feeding (SF), were used in the feeding trial. Moreover, the feeding trial had the following five different feeding phases.
Values
The Stamfisk site provides two sets of values, both of which represent measured levels of nutrients/metabolites.
- Orig: Original value in character type. It contains the original <LOQ values.
- Value: Converted value in numeric type (double). All <LOQ values are converted to numeric values using a random imputation approach (see Imputation of LOQ values for details)
Proximate composition
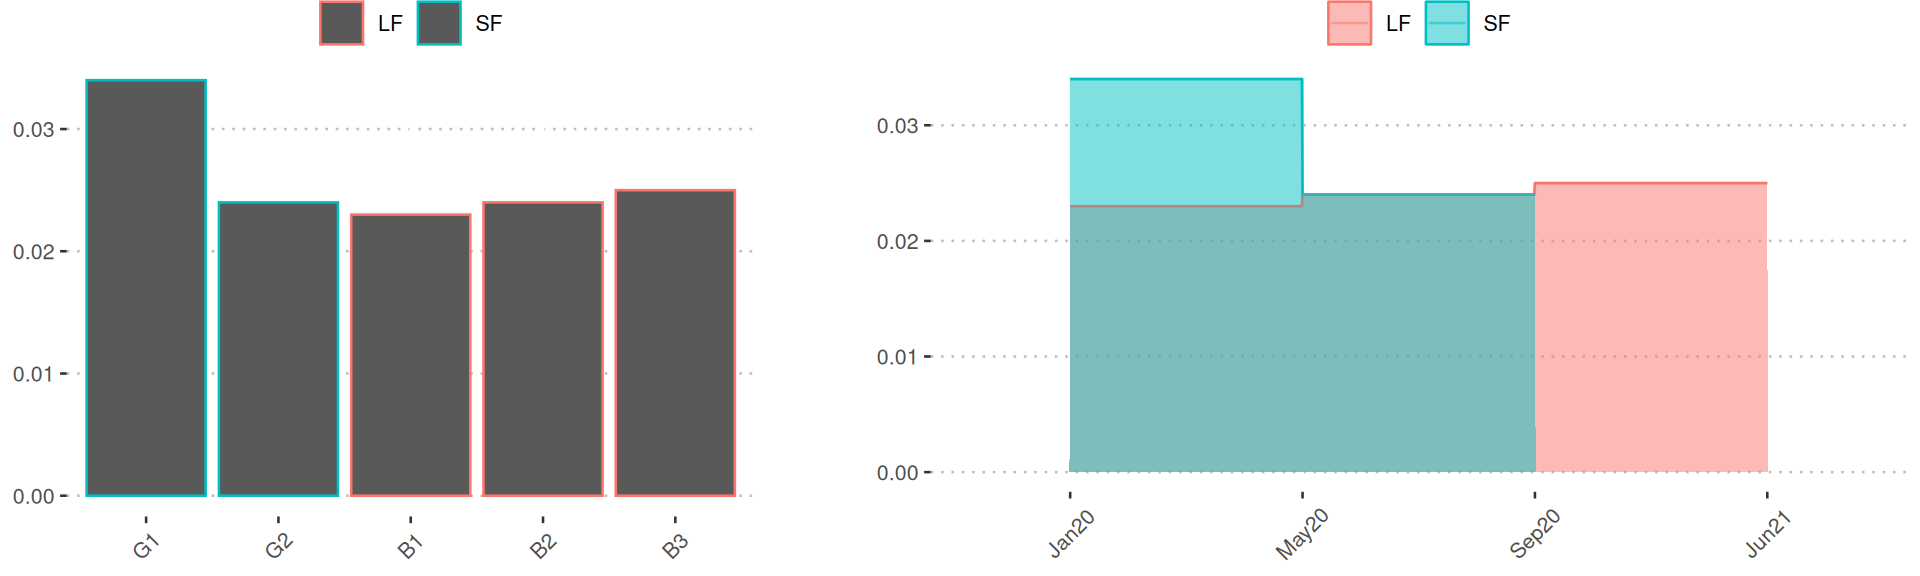
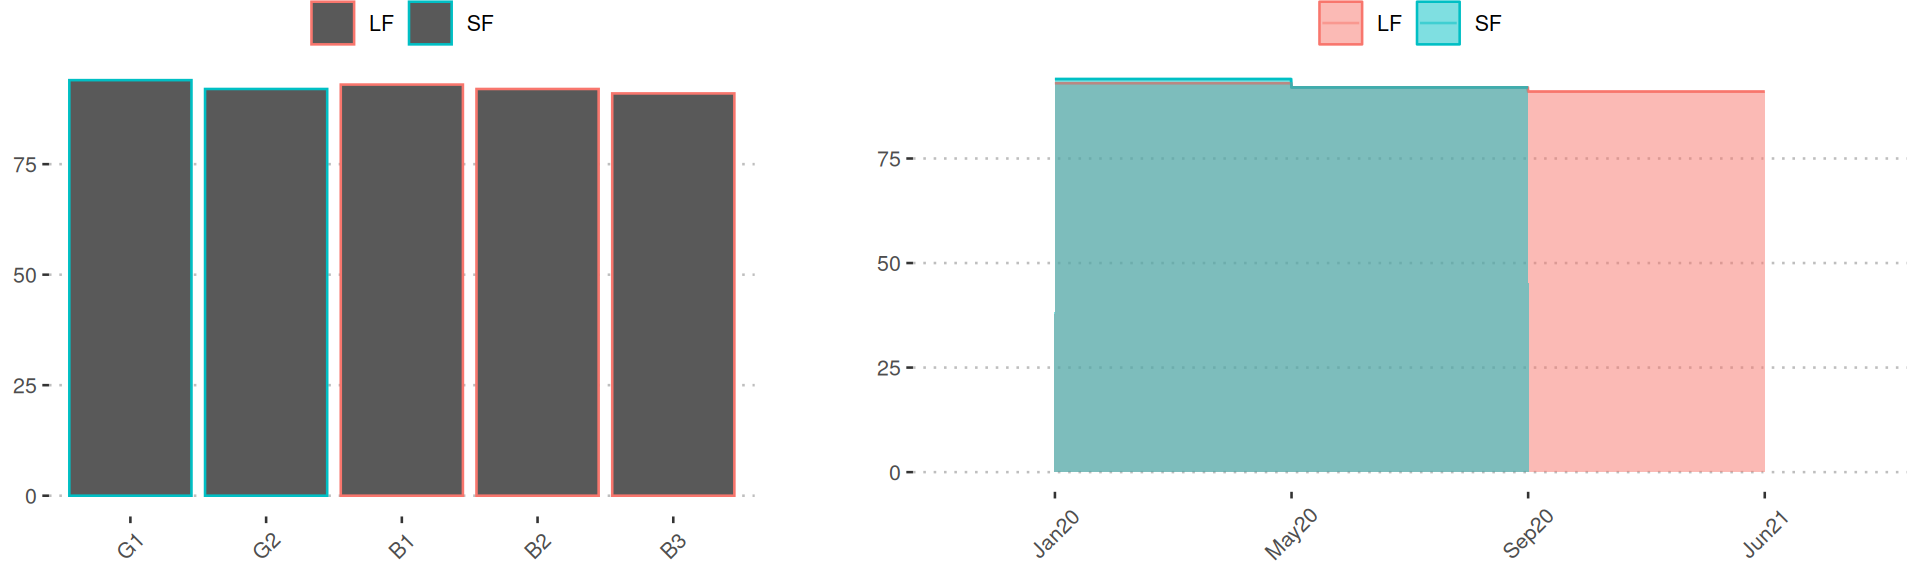
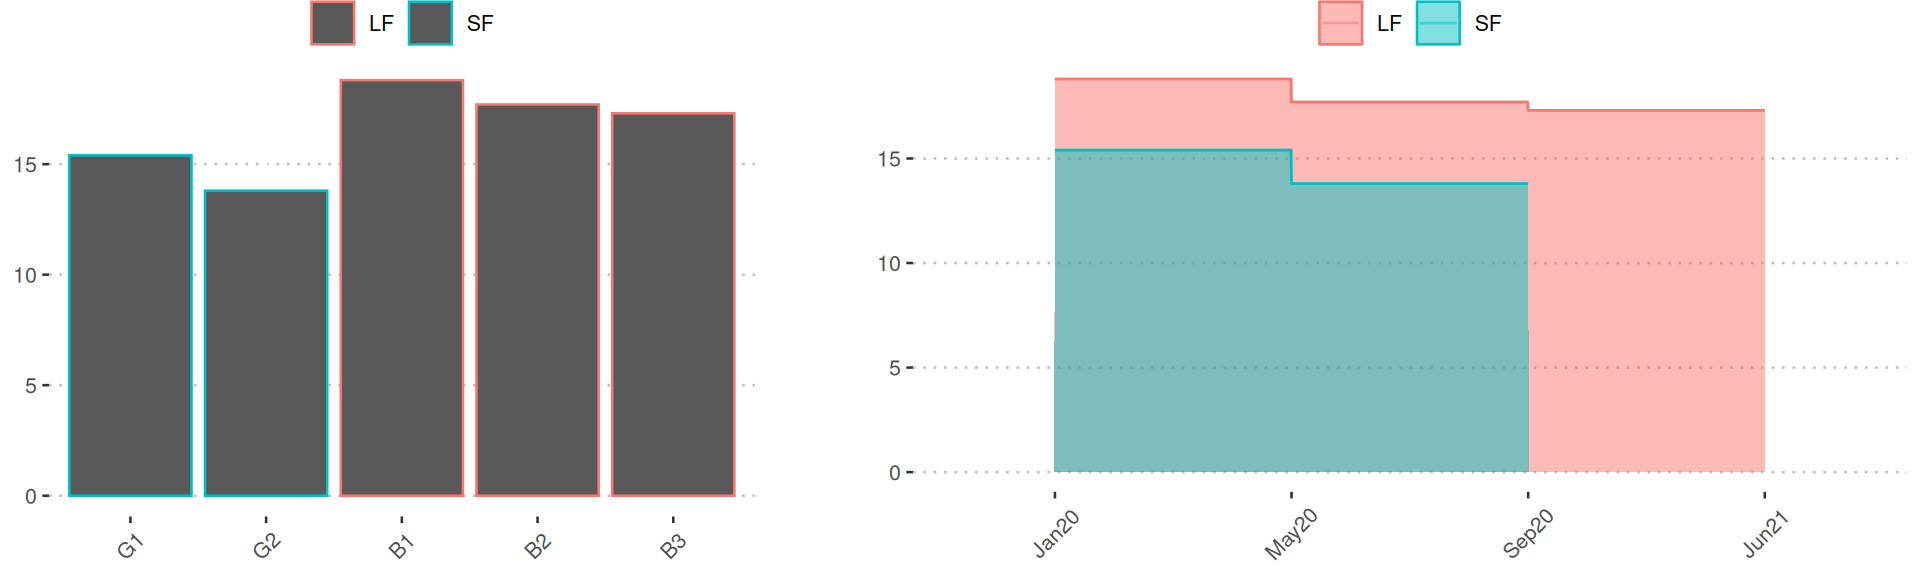
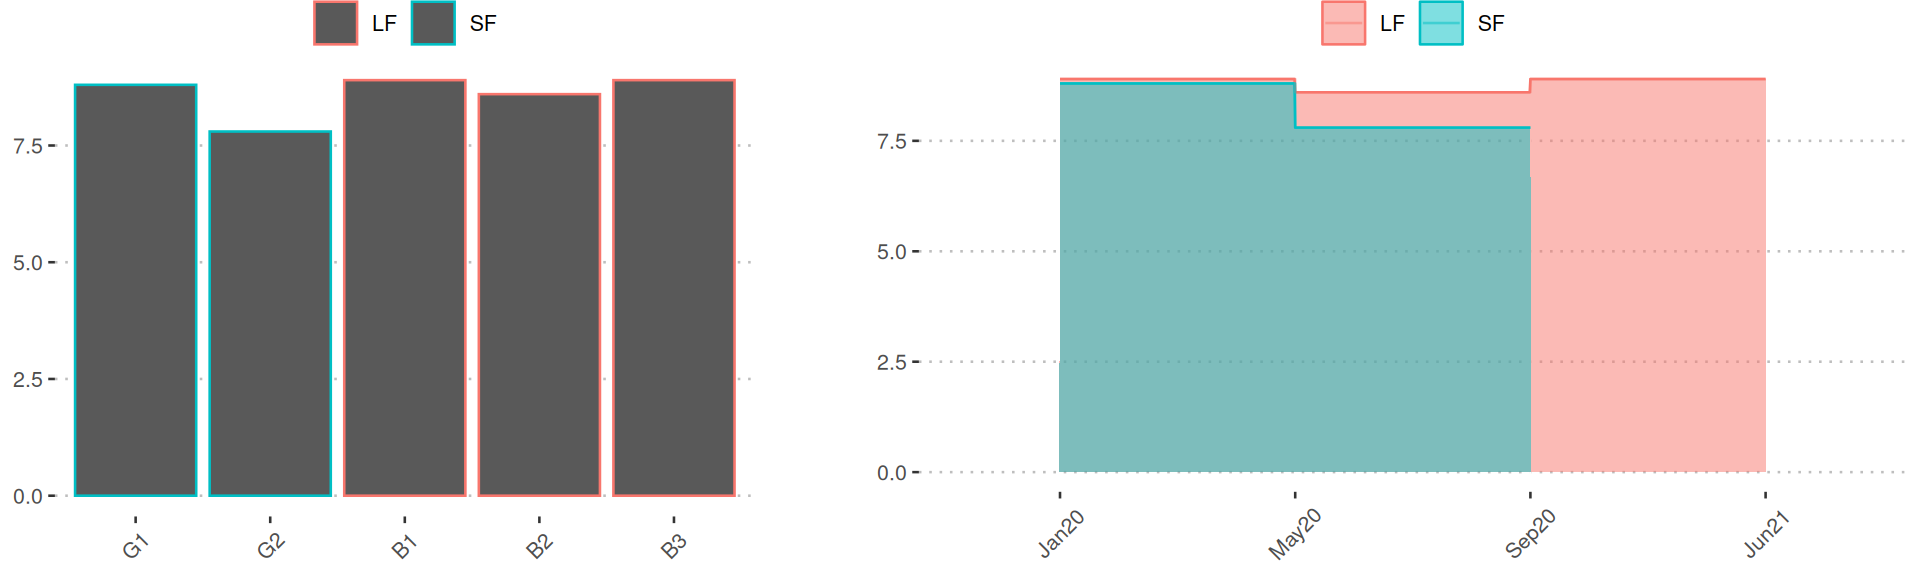
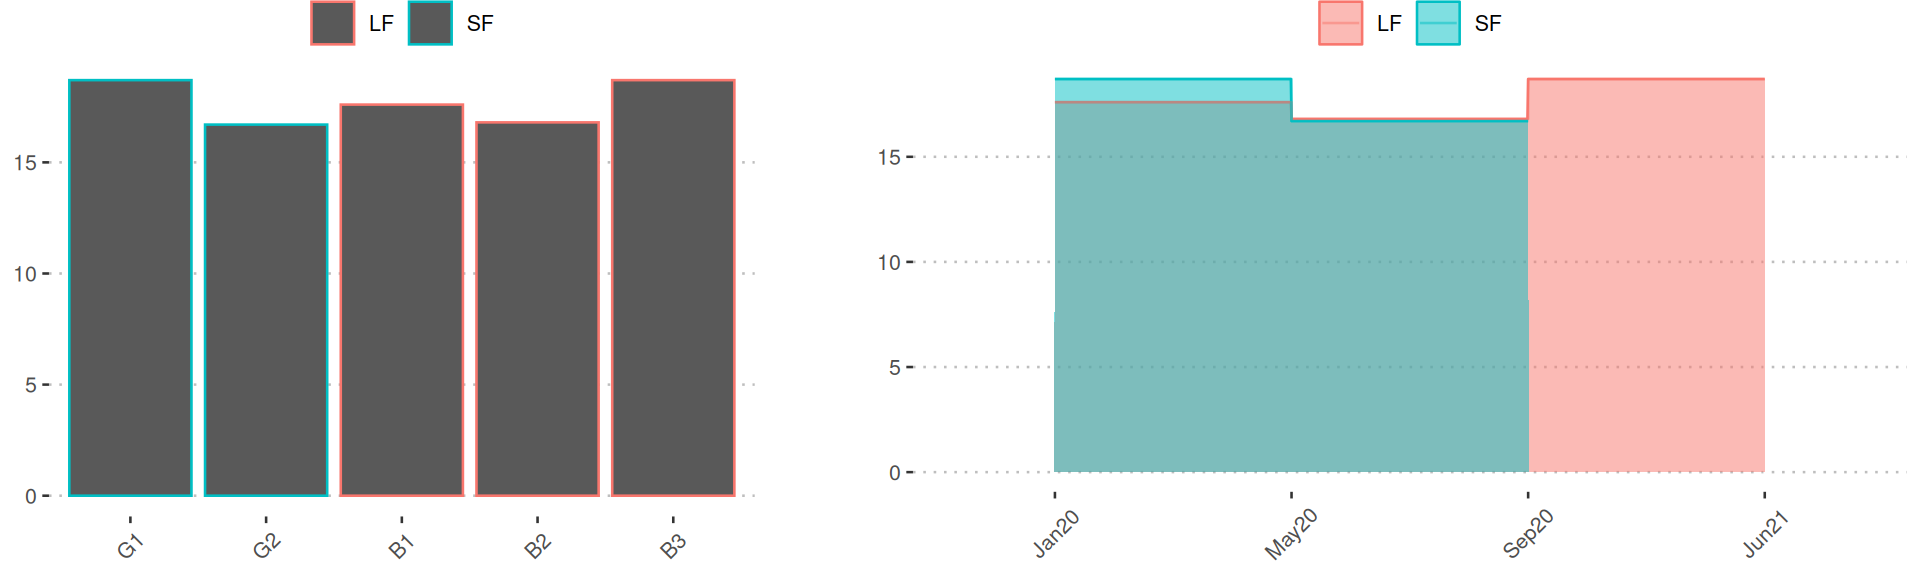
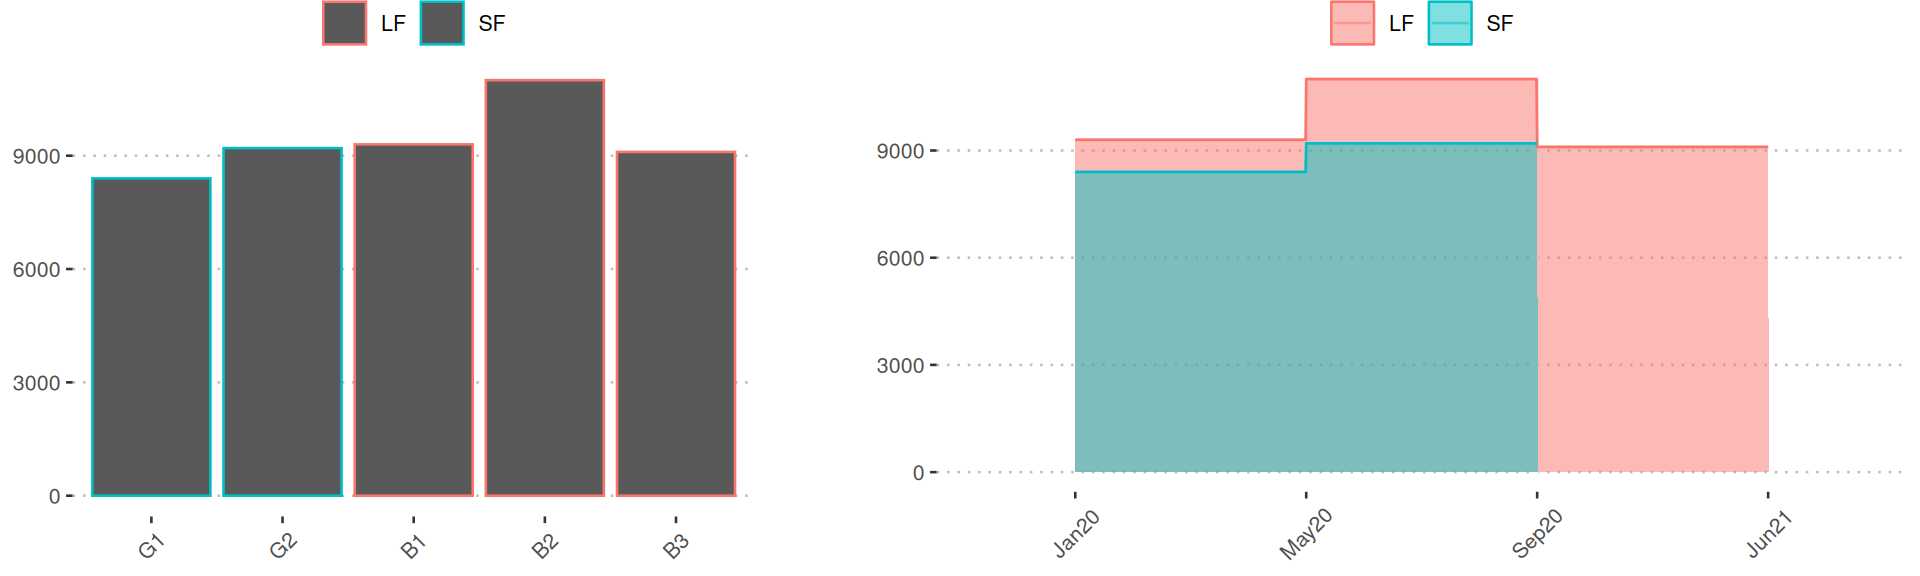
Crude protein
1. Table
2. Unit
g/100g ww3. Plots
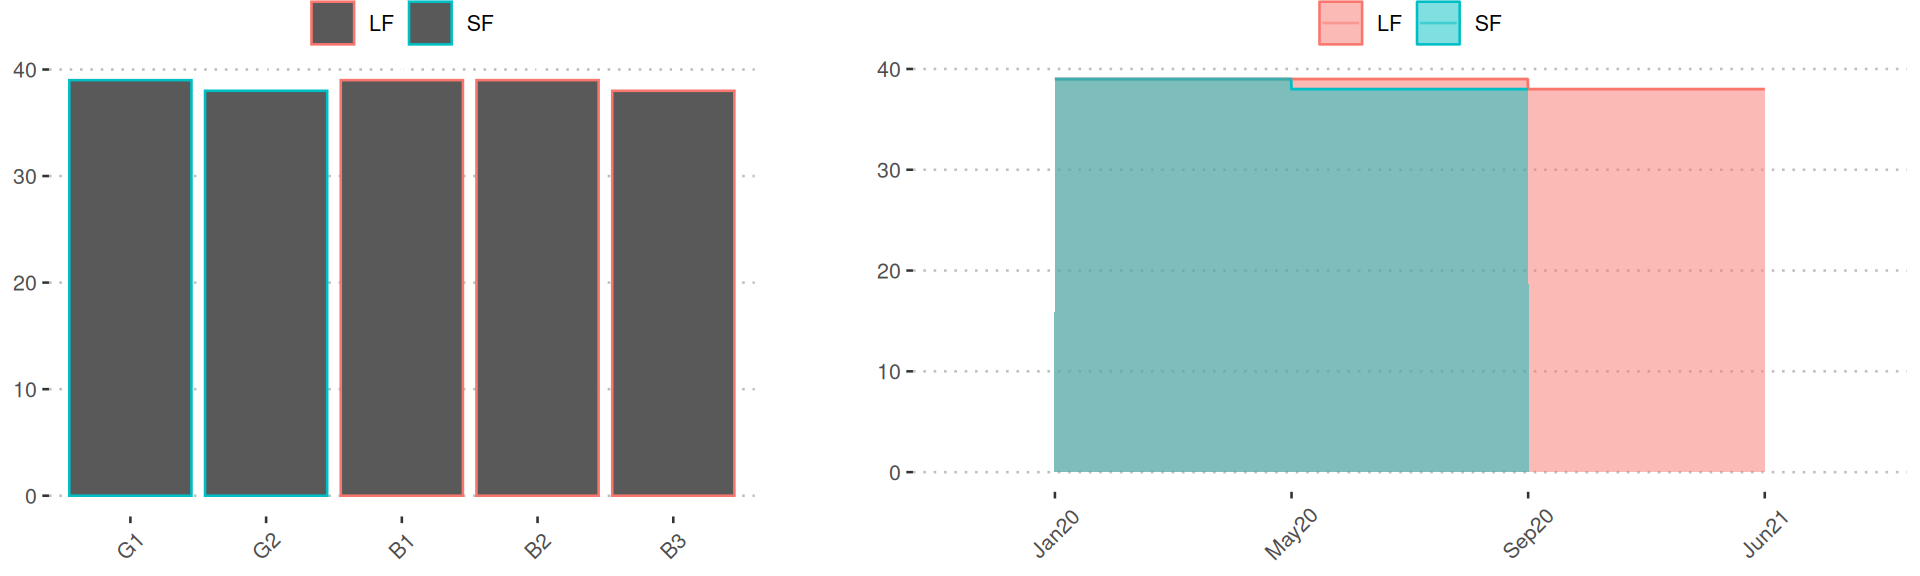
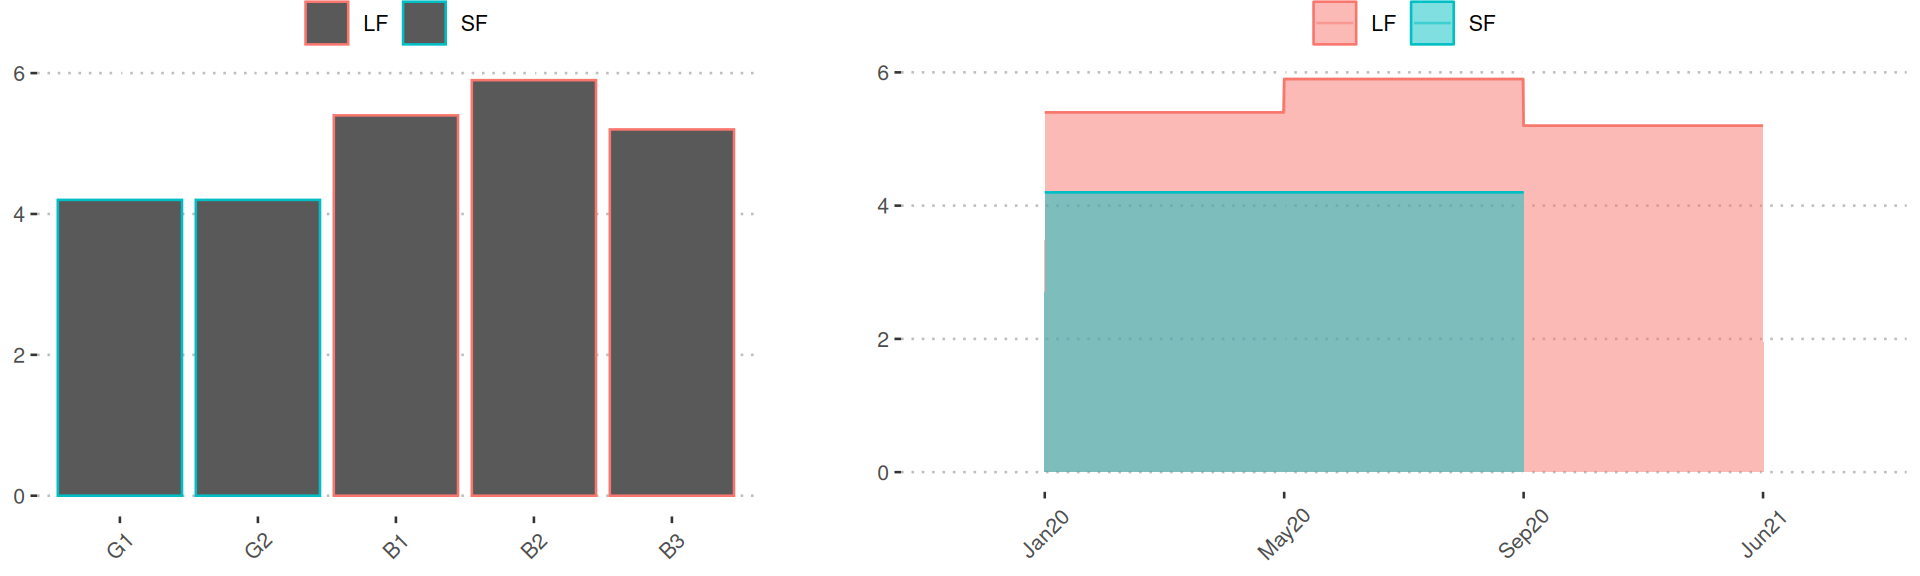
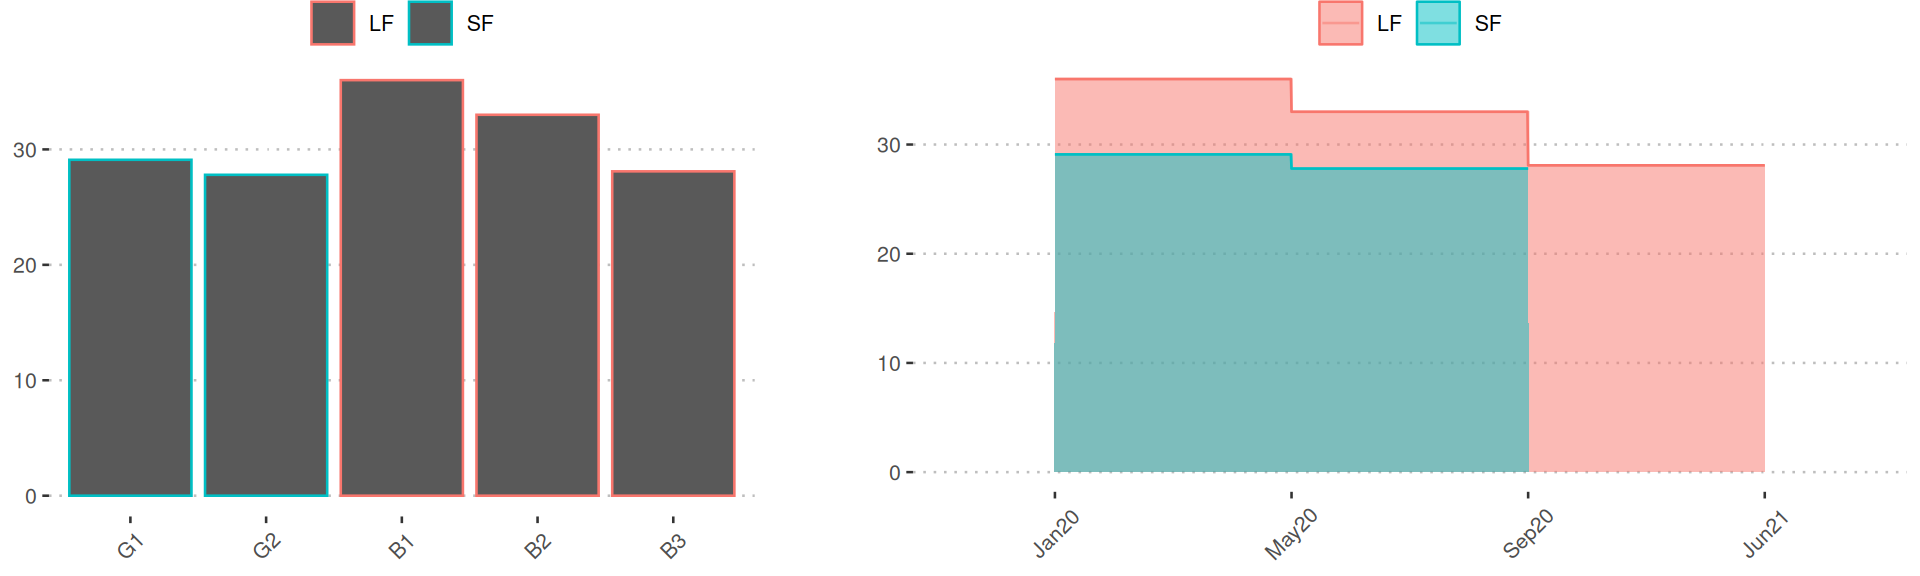
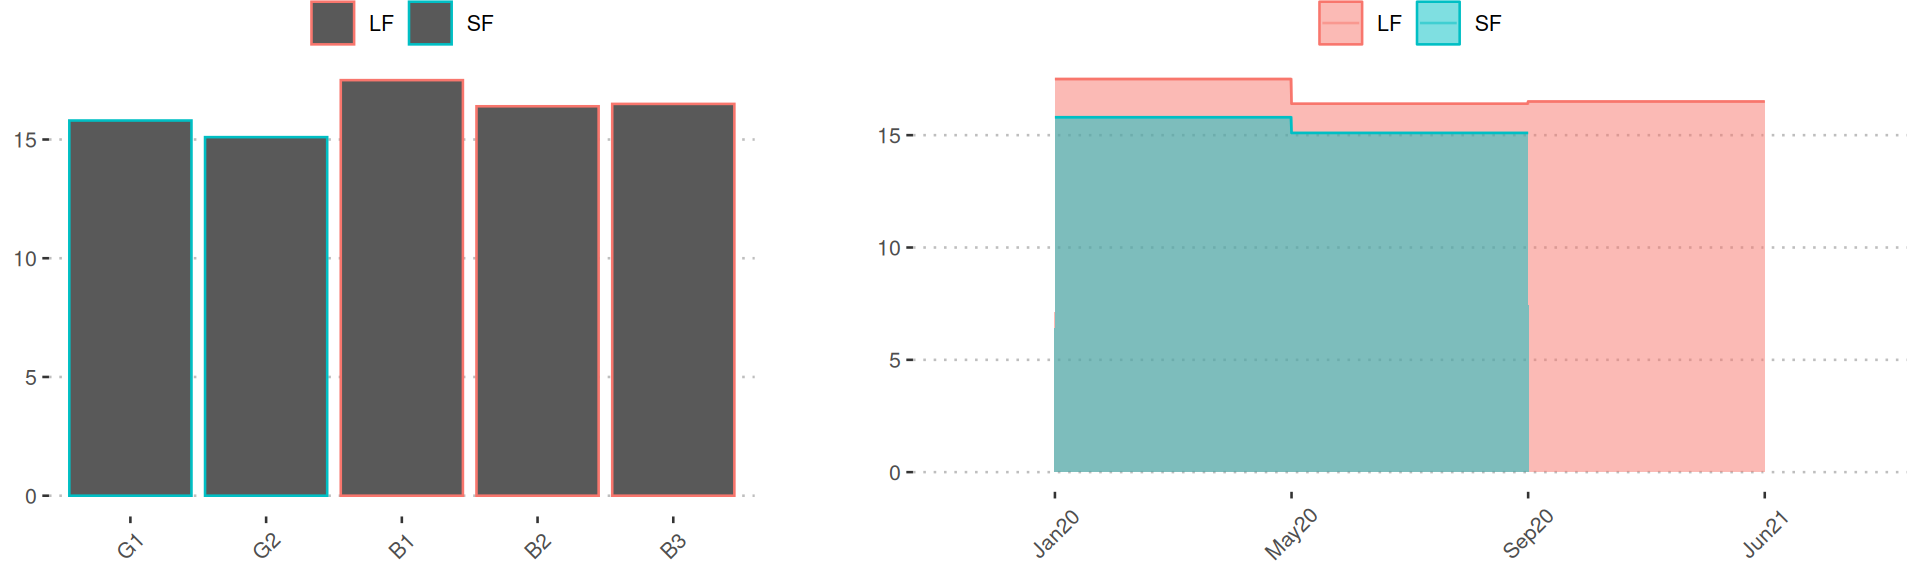
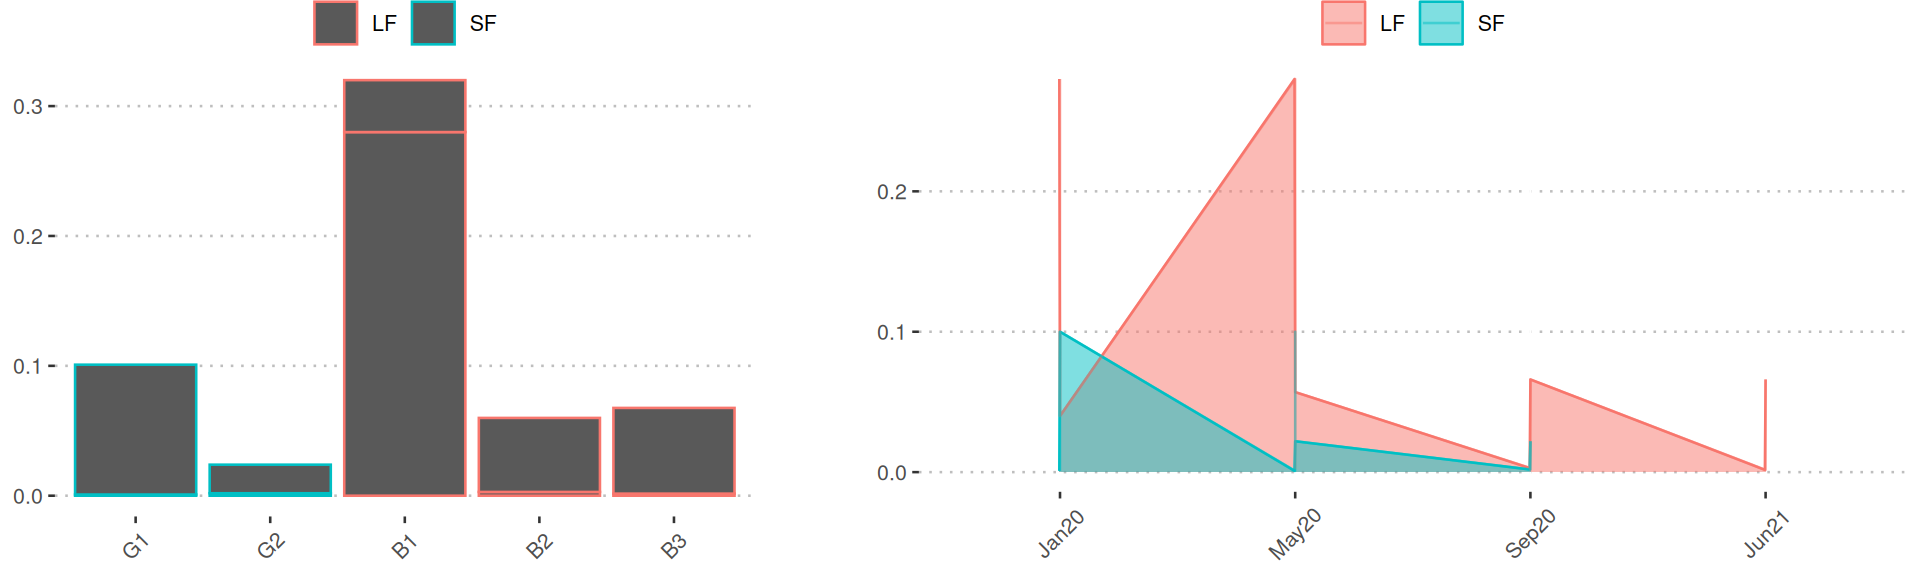
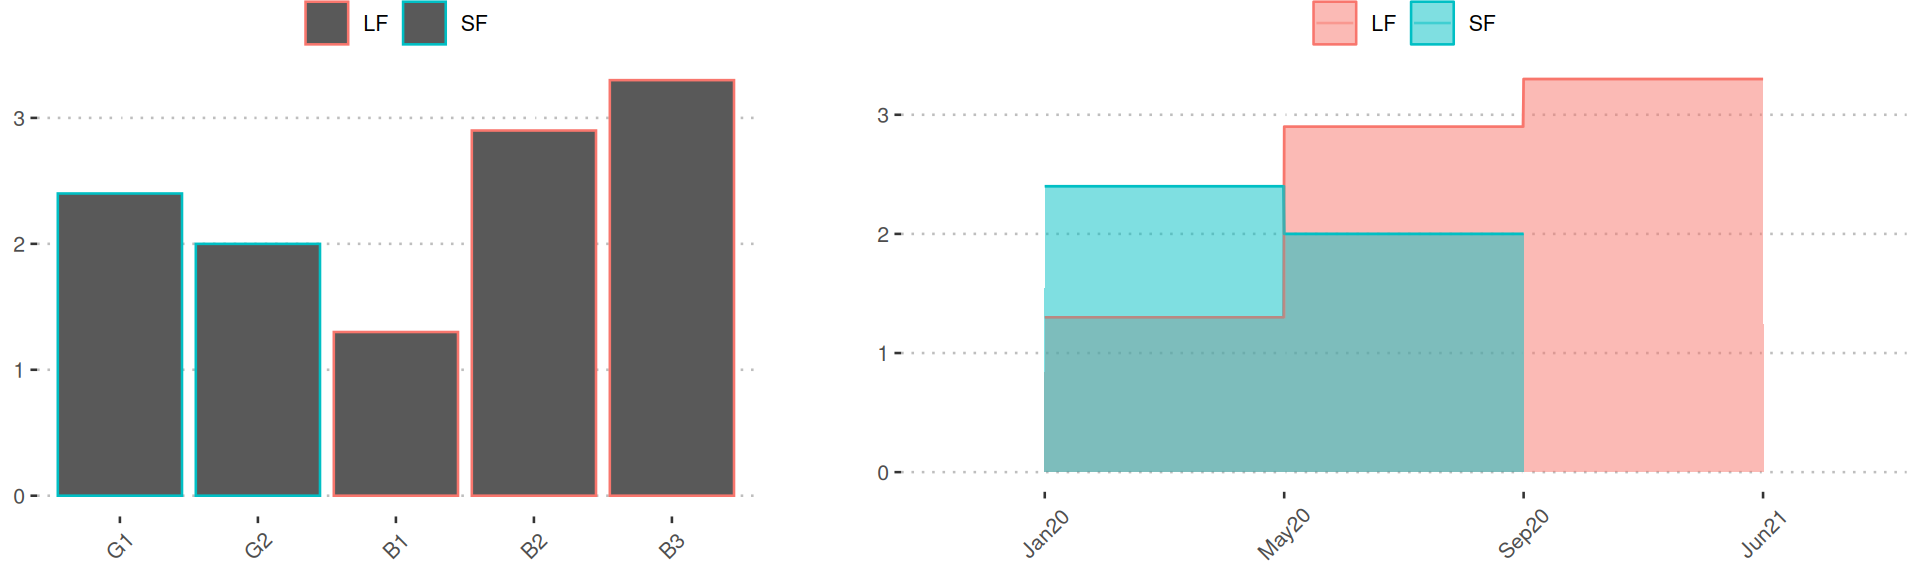
Fat
1. Table
2. Unit
g/100g ww3. Plots
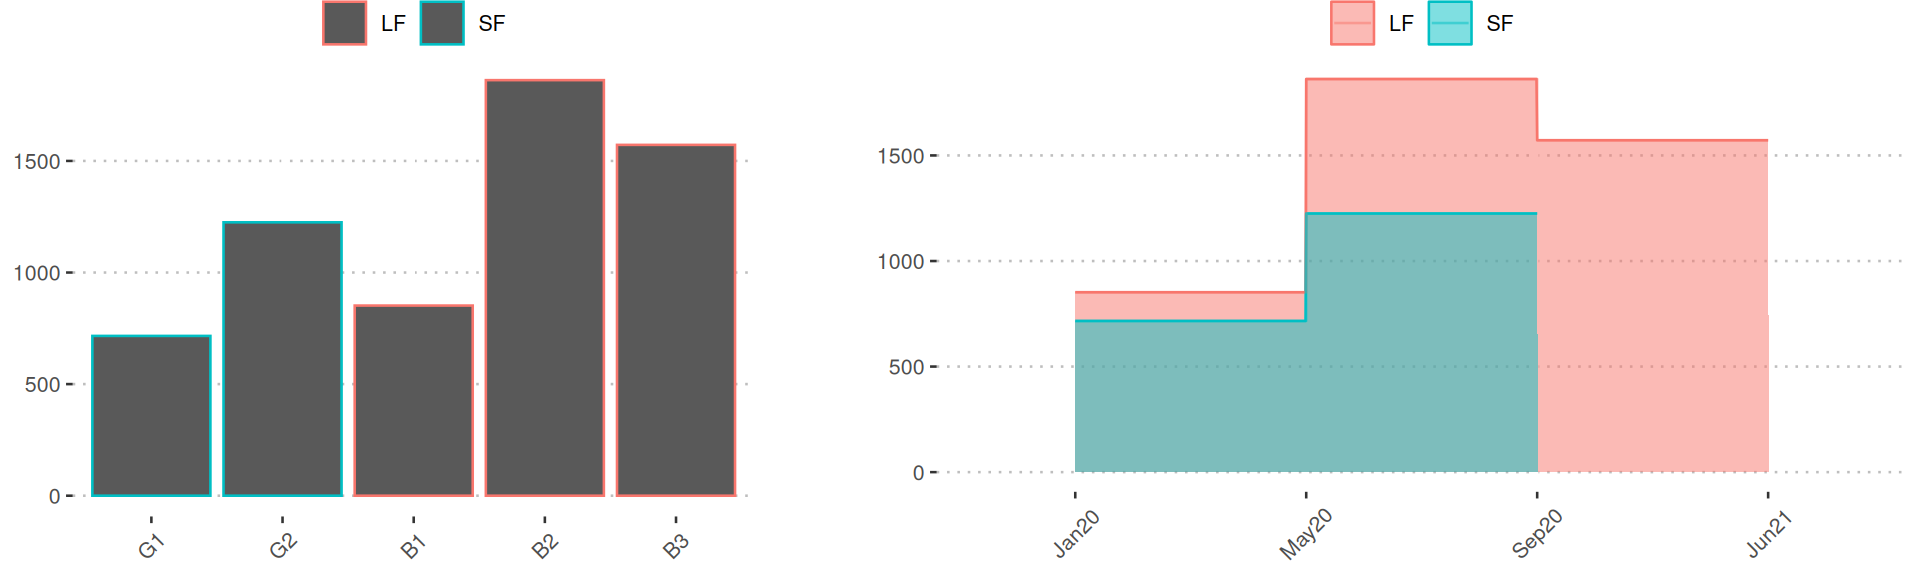
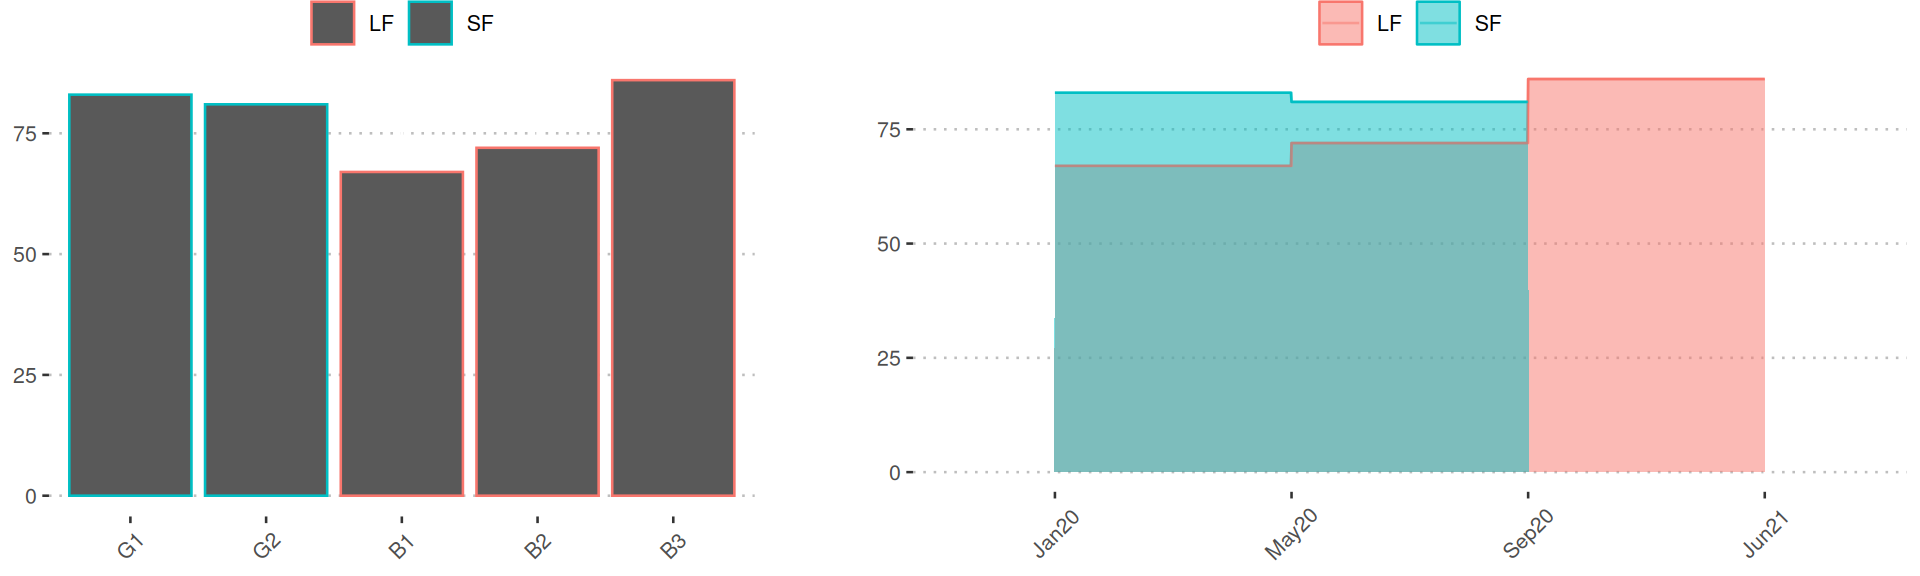
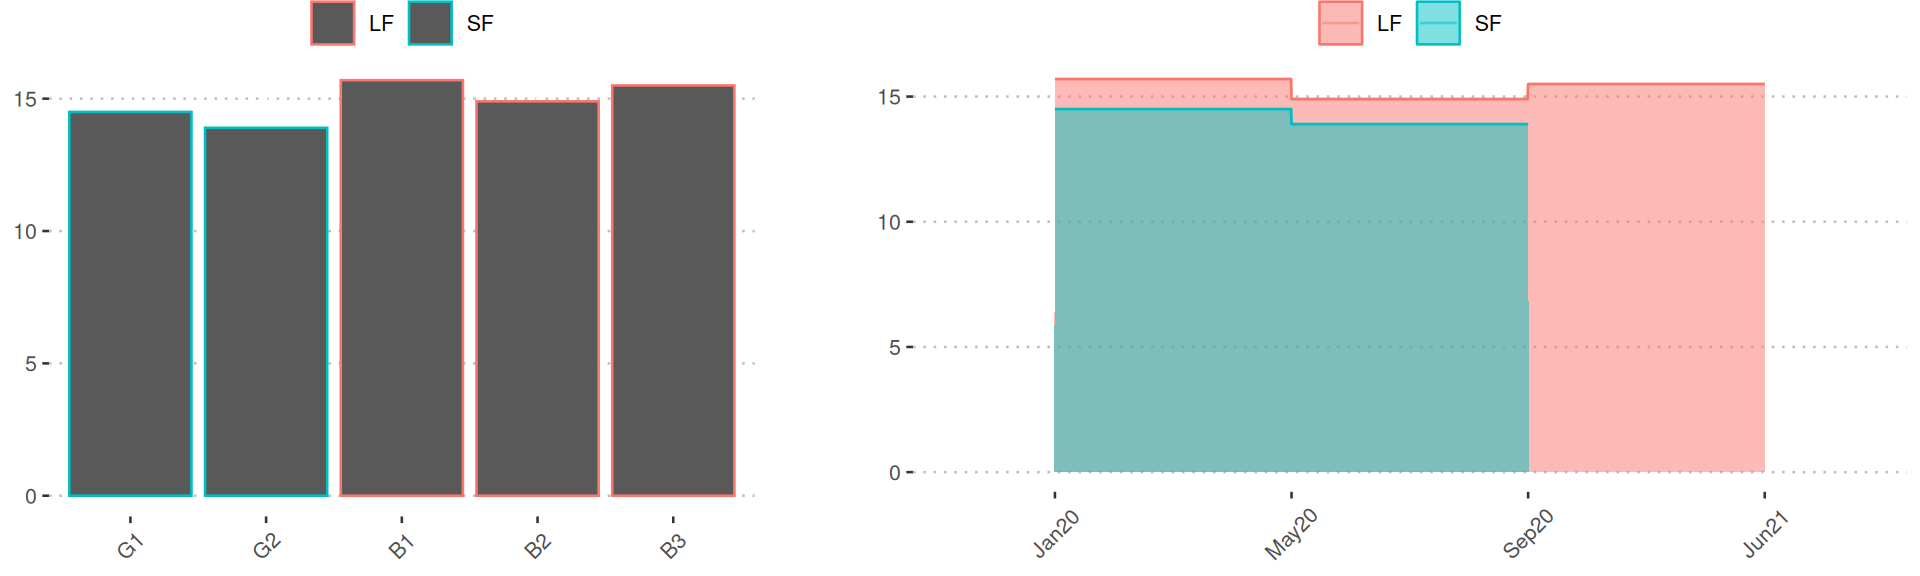
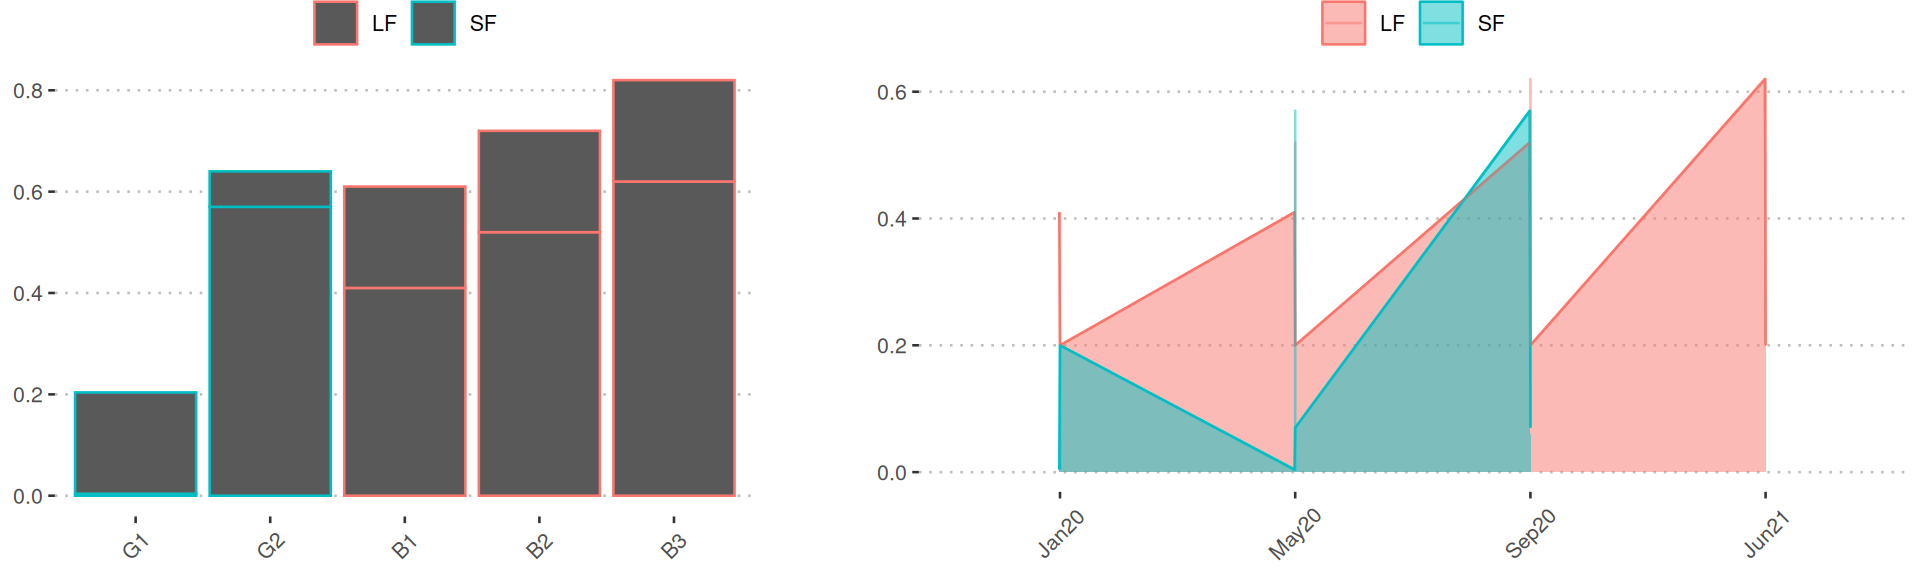
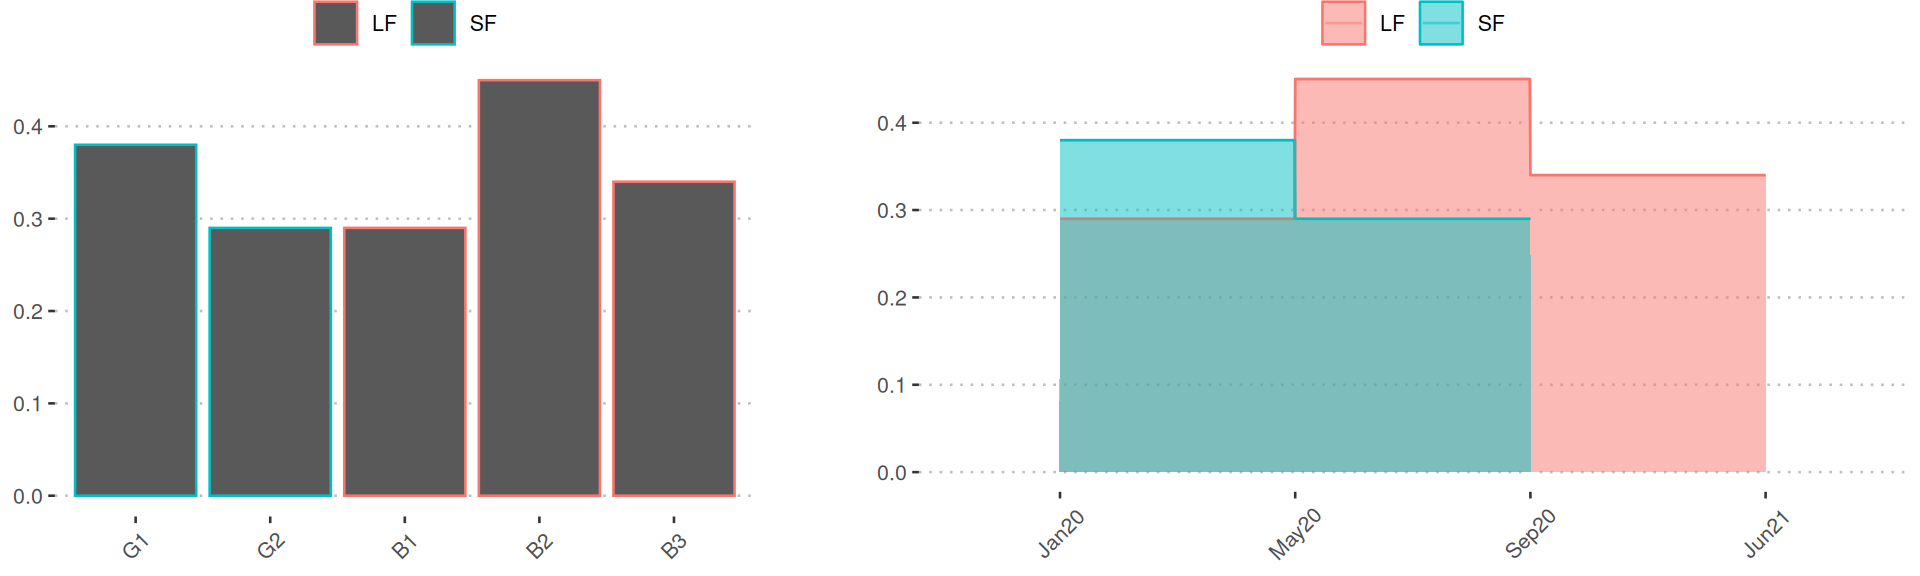
Carbohydrates
1. Table
2. Unit
g/100g ww3. Plots
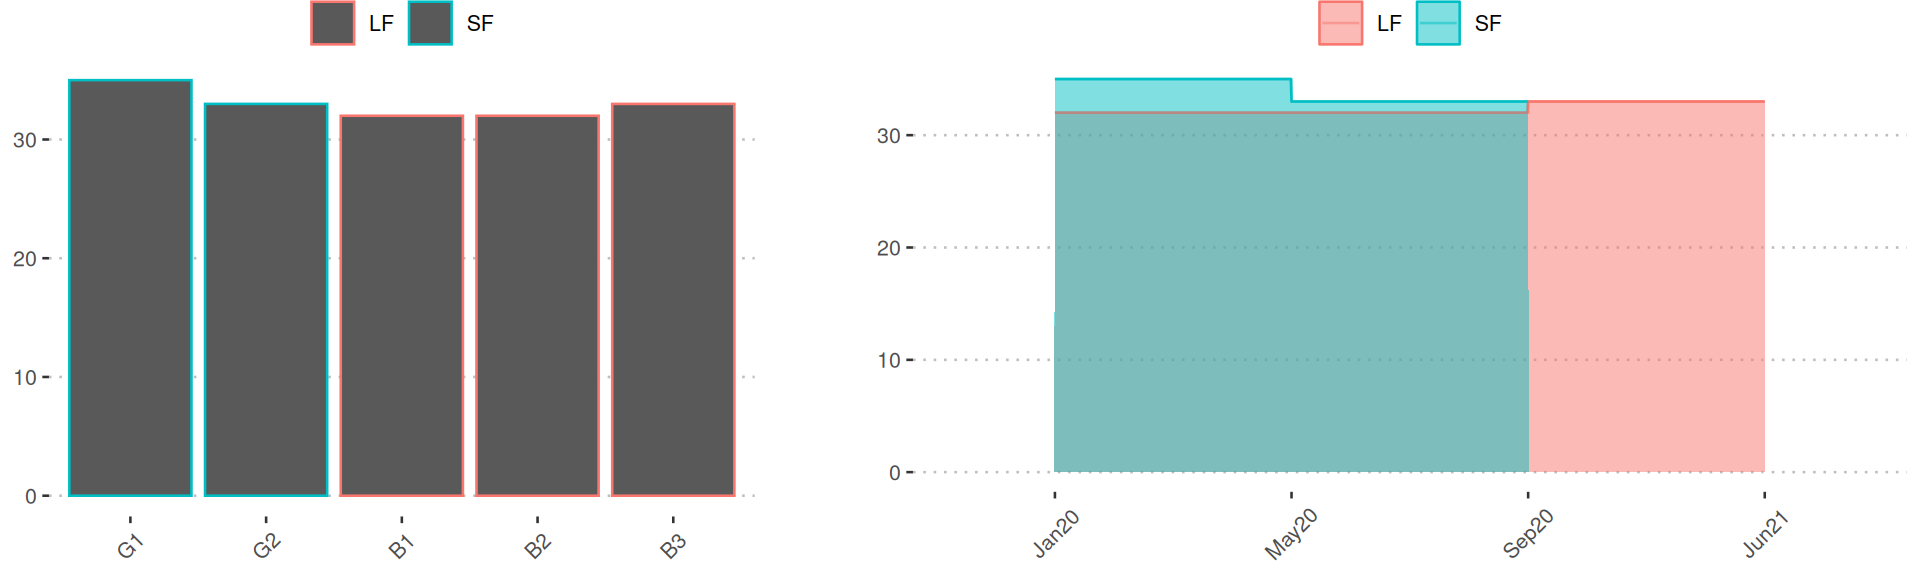
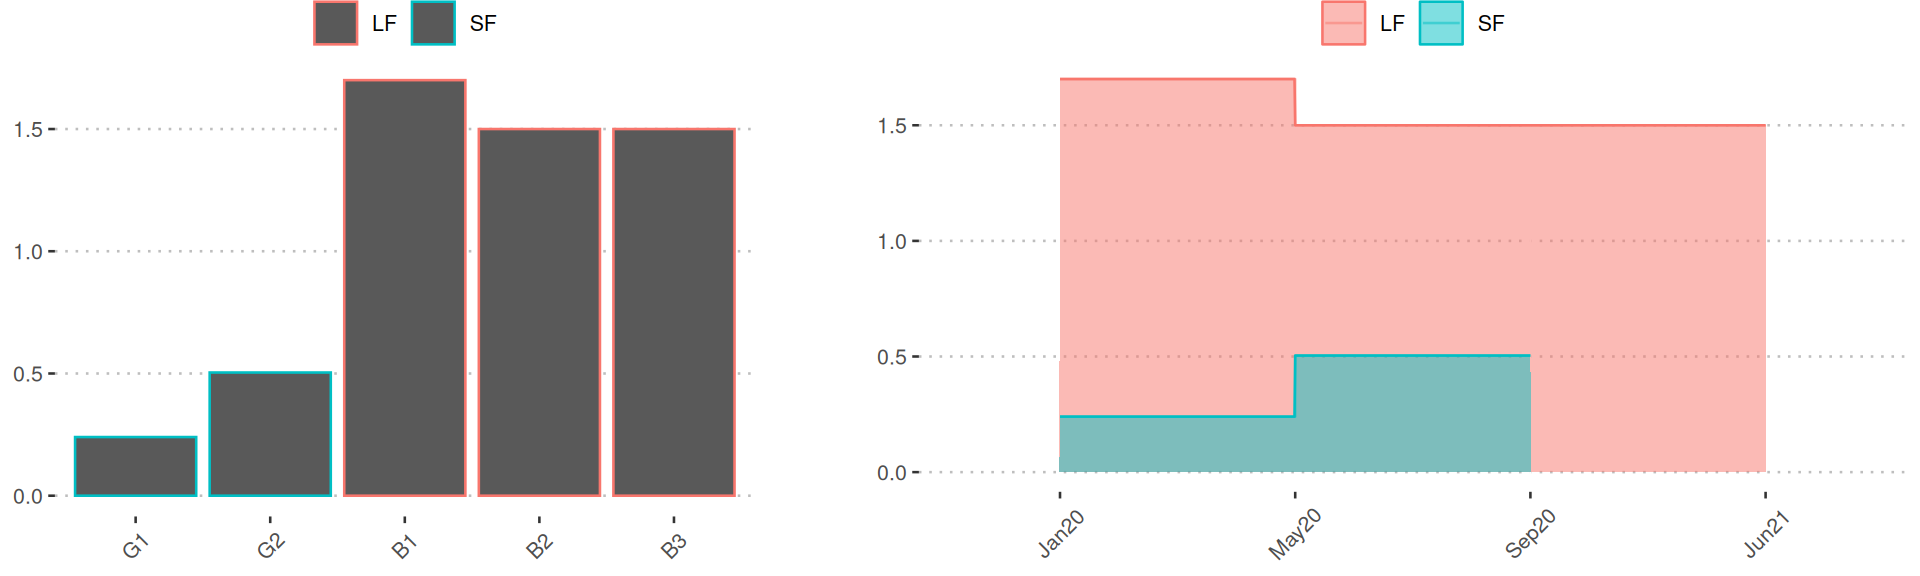
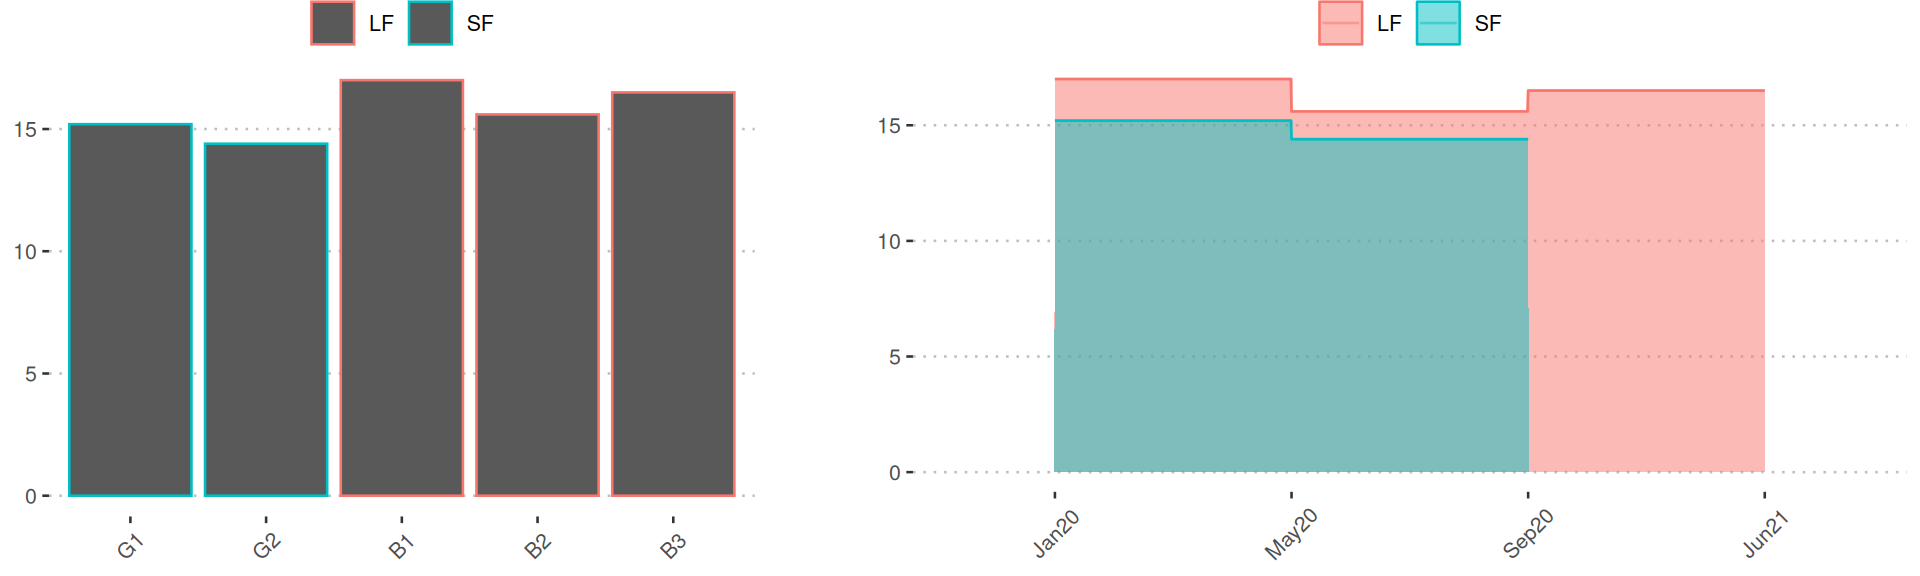
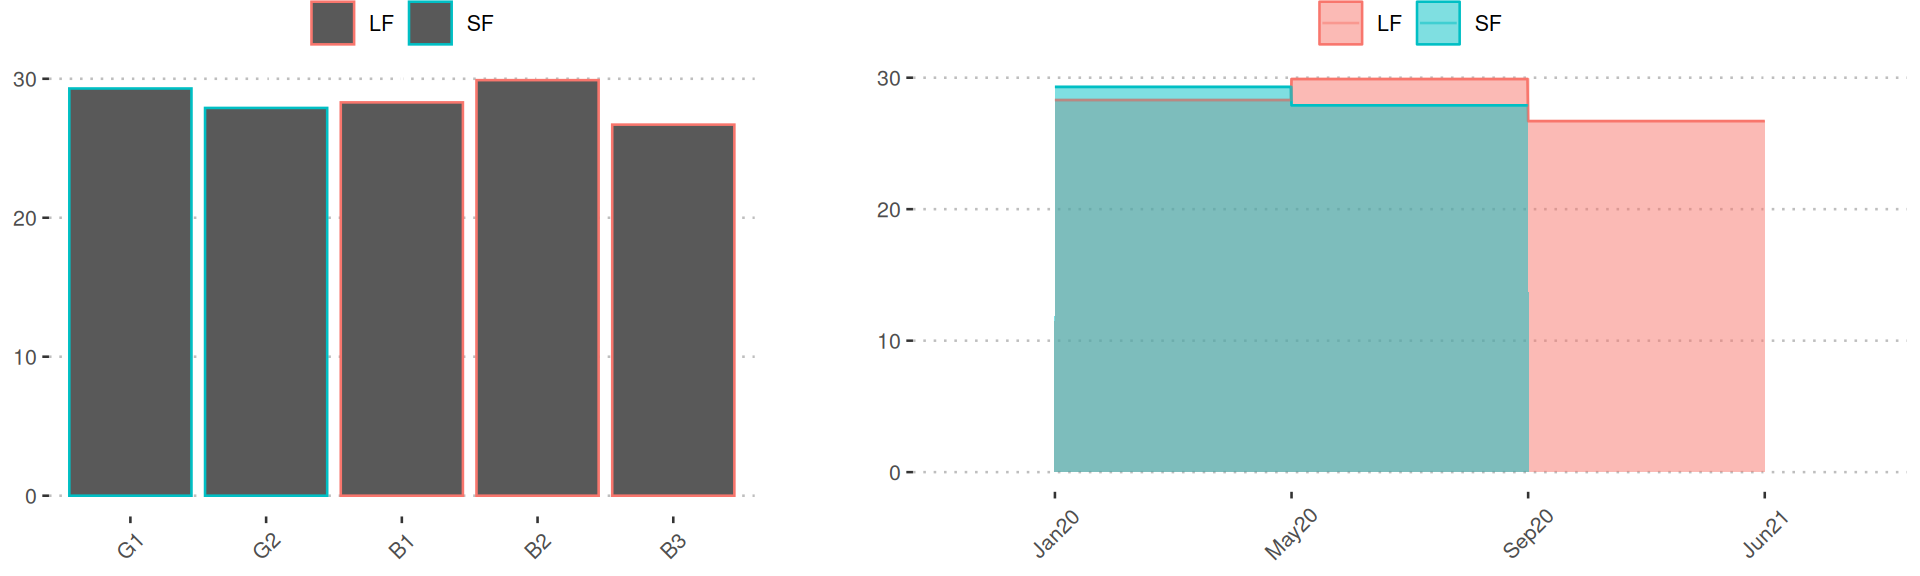
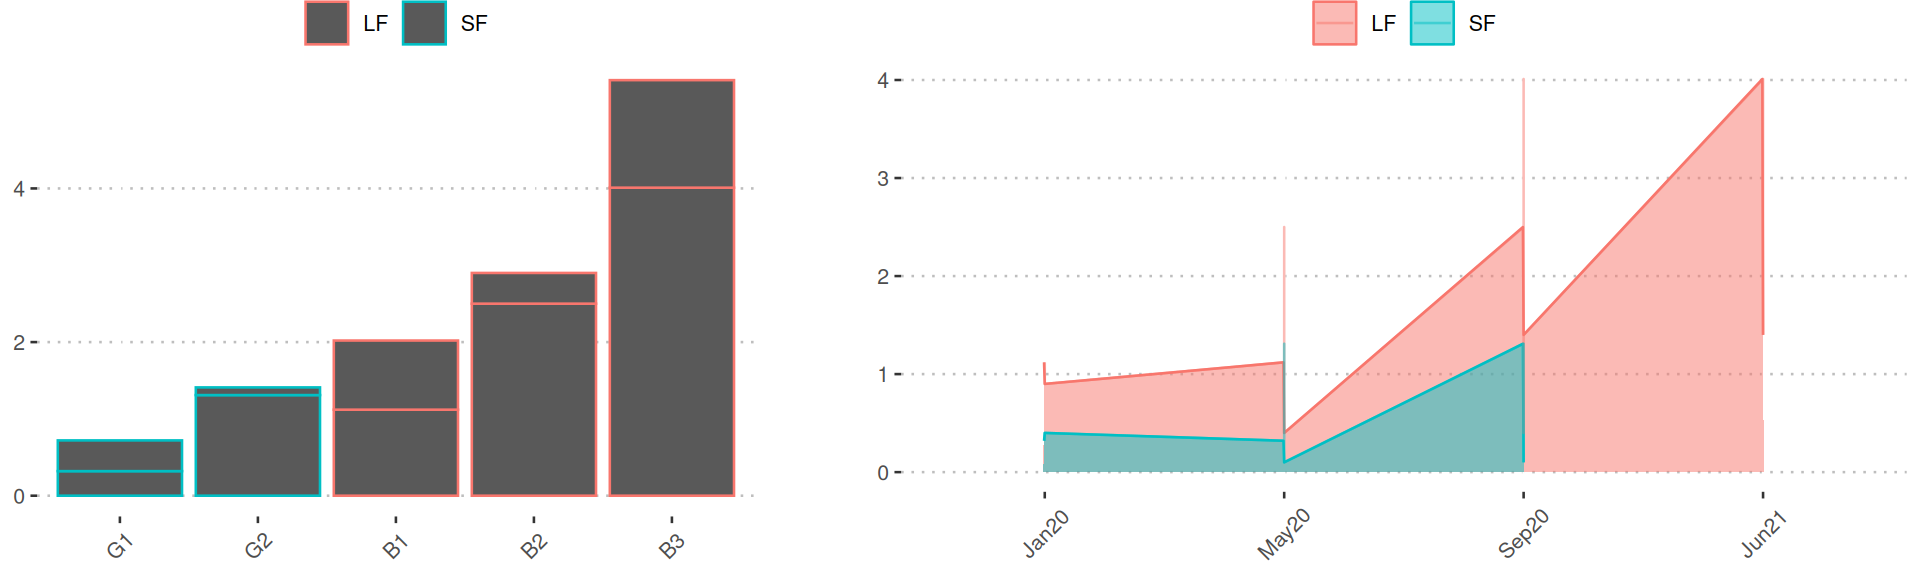
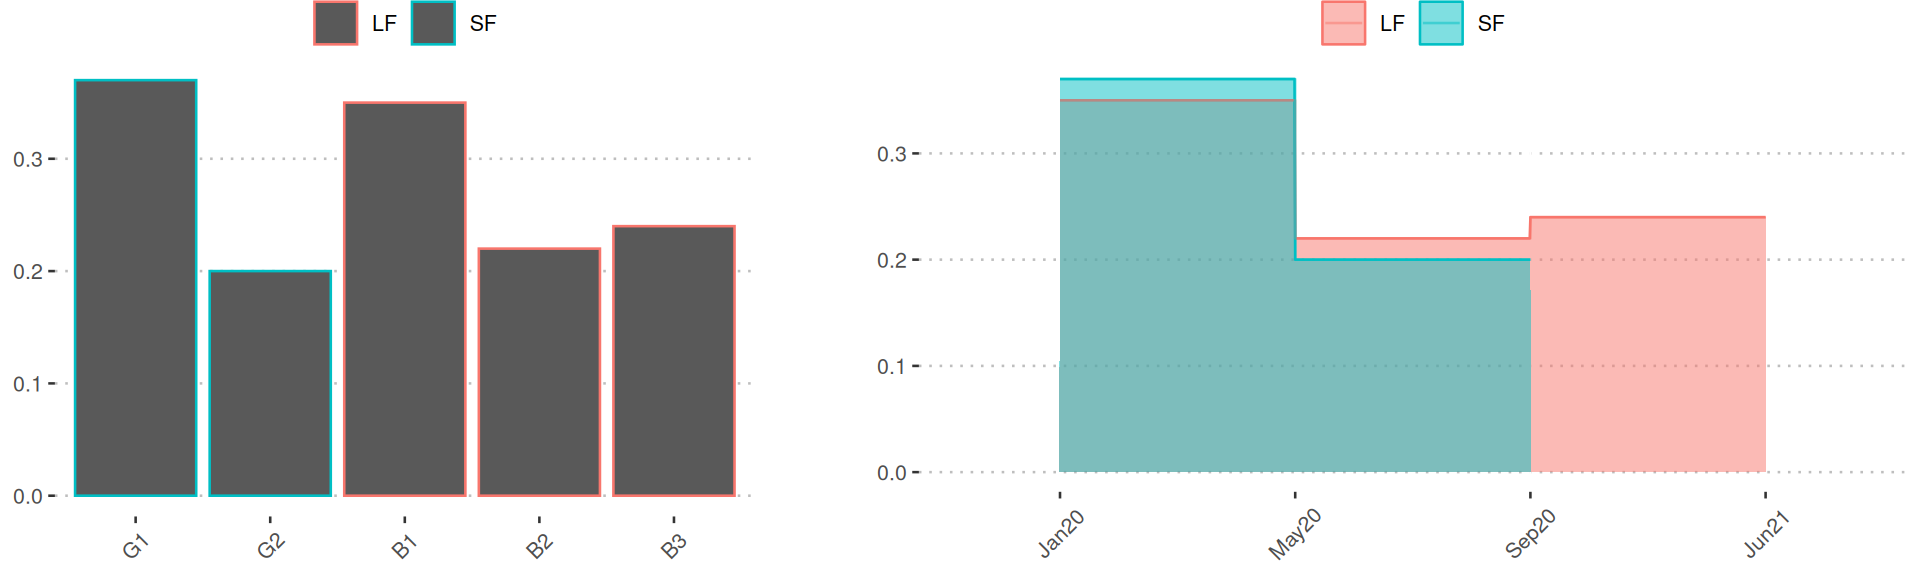
Dry matter
1. Table
2. Unit
g/100g ww3. Plots
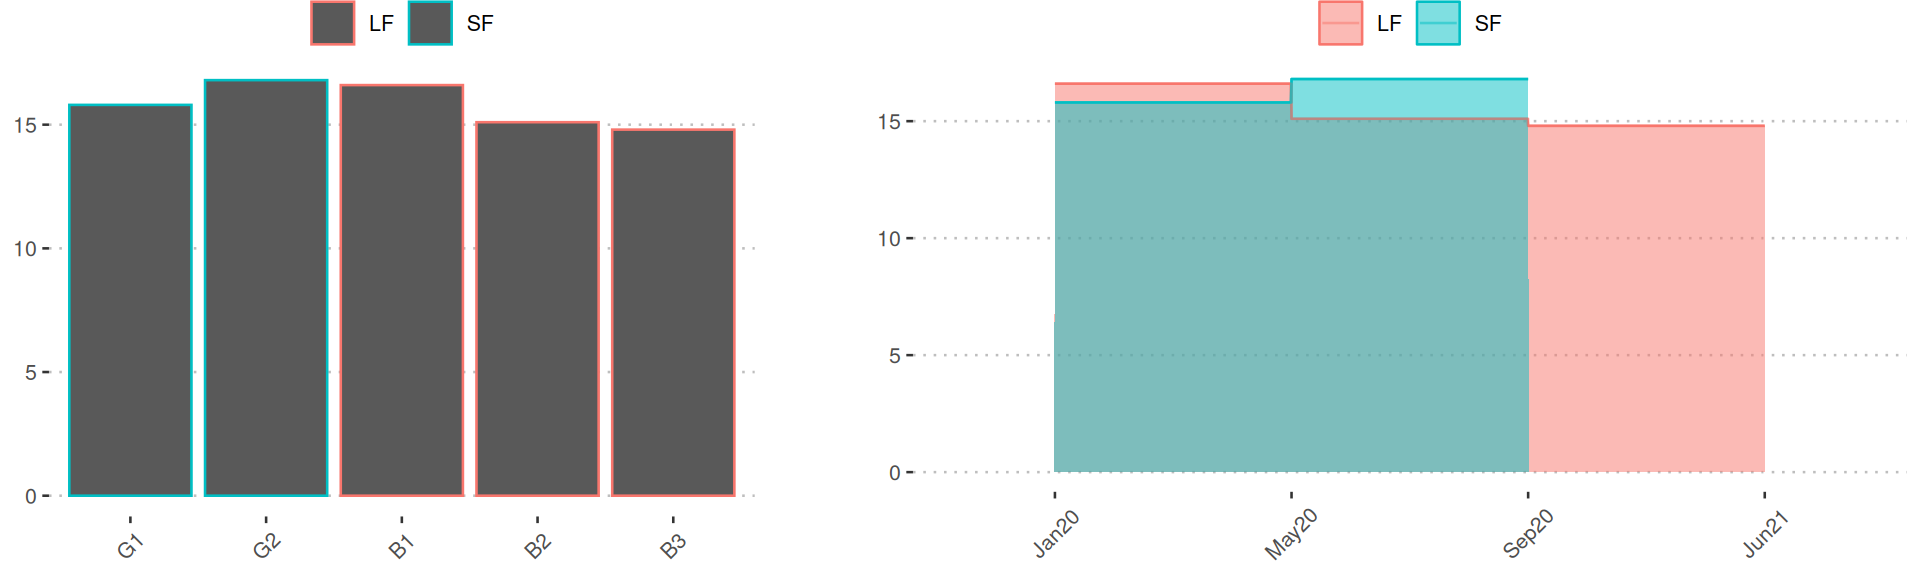
Ash
1. Table
2. Unit
g/100g ww3. Plots
Lipids
Cholesterol
1. Table
2. Unit
mg/kg ww3. Plots
Amino acids
Hydroxy-Proline
1. Table
2. Unit
mg/g ww3. Plots
Histidine
1. Table
2. Unit
mg/g ww3. Plots
Taurine
1. Table
2. Unit
mg/g ww3. Plots
Serine
1. Table
2. Unit
mg/g ww3. Plots
Arginine
1. Table
2. Unit
mg/g ww3. Plots
Glycine
1. Table
2. Unit
mg/g ww3. Plots
Aspartic acid
1. Table
2. Unit
mg/g ww3. Plots
Glutamic acid
1. Table
2. Unit
mg/g ww3. Plots
Threonine
1. Table
2. Unit
mg/g ww3. Plots
Alanine
1. Table
2. Unit
mg/g ww3. Plots
Proline
1. Table
2. Unit
mg/g ww3. Plots
Lysine
1. Table
2. Unit
mg/g ww3. Plots
Tyrosine
1. Table
2. Unit
mg/g ww3. Plots
Methionine
1. Table
2. Unit
mg/g ww3. Plots
Valine
1. Table
2. Unit
mg/g ww3. Plots
Isoleucine
1. Table
2. Unit
mg/g ww3. Plots
Leucine
1. Table
2. Unit
mg/g ww3. Plots
Phenylalanine
1. Table
2. Unit
mg/g ww3. Plots
Fatty acids
14:1n-9
1. Table
2. Unit
mg/g ww3. Plots
16:1n-9
1. Table
2. Unit
mg/g ww3. Plots
16:1n-7
1. Table
2. Unit
mg/g ww3. Plots

16:2n-4
1. Table
2. Unit
mg/g ww3. Plots
16:3n-3
1. Table
2. Unit
mg/g ww3. Plots
18:1n-11
1. Table
2. Unit
mg/g ww3. Plots
18:1n-9
1. Table
2. Unit
mg/g ww3. Plots
18:1n-7
1. Table
2. Unit
mg/g ww3. Plots
16:4n-3
1. Table
2. Unit
mg/g ww3. Plots
18:2n-6
1. Table
2. Unit
mg/g ww3. Plots
18:3n-6
1. Table
2. Unit
mg/g ww3. Plots
18:3n-3
1. Table
2. Unit
mg/g ww3. Plots
20:1n-11
1. Table
2. Unit
mg/g ww3. Plots
20:1n-9
1. Table
2. Unit
mg/g ww3. Plots
20:1n-7
1. Table
2. Unit
mg/g ww3. Plots
18:4n-3
1. Table
2. Unit
mg/g ww3. Plots
20:2n-6
1. Table
2. Unit
mg/g ww3. Plots
20:3n-9
1. Table
2. Unit
mg/g ww3. Plots
20:3n-6
1. Table
2. Unit
mg/g ww3. Plots
20:3n-3
1. Table
2. Unit
mg/g ww3. Plots
20:4n-6 (ARA)
1. Table
2. Unit
mg/g ww3. Plots
22:1n-11
1. Table
2. Unit
mg/g ww3. Plots
22:1n-9
1. Table
2. Unit
mg/g ww3. Plots
20:4n-3
1. Table
2. Unit
mg/g ww3. Plots
20:5n-3 (EPA)
1. Table
2. Unit
mg/g ww3. Plots
22:4n-6
1. Table
2. Unit
mg/g ww3. Plots
21:5n-3
1. Table
2. Unit
mg/g ww3. Plots
24:1n-9
1. Table
2. Unit
mg/g ww3. Plots
22:5n-6
1. Table
2. Unit
mg/g ww3. Plots
22:5n-3 (DPA)
1. Table
2. Unit
mg/g ww3. Plots
22:6n-3 (DHA)
1. Table
2. Unit
mg/g ww3. Plots
24:5n-3
1. Table
2. Unit
mg/g ww3. Plots
24:6n-3
1. Table
2. Unit
mg/g ww3. Plots
Fatty acid total
Sum unidentified
1. Table
2. Unit
mg/g ww3. Plots
Sum identified
1. Table
2. Unit
mg/g ww3. Plots
Sum fatty acids
1. Table
2. Unit
mg/g ww3. Plots
Sum saturated
1. Table
2. Unit
mg/g ww3. Plots
Sum 16:1
1. Table
2. Unit
mg/g ww3. Plots
Sum 18:1
1. Table
2. Unit
mg/g ww3. Plots
Sum 20:1
1. Table
2. Unit
mg/g ww3. Plots
Sum 22:1
1. Table
2. Unit
mg/g ww3. Plots
Sum monounsaturated
1. Table
2. Unit
mg/g ww3. Plots
Sum EPA + DHA
1. Table
2. Unit
mg/g ww3. Plots
Sum n-3
1. Table
2. Unit
mg/g ww3. Plots
Sum n-6
1. Table
2. Unit
mg/g ww3. Plots
Sum polyunsaturated
1. Table
2. Unit
mg/g ww3. Plots
Fatty acid ratio
n-6/n-3
1. Table
2. Unit
-3. Plots
Vitamins
Biotin (B7)
1. Table
2. Unit
mg/kg ww3. Plots
Cobalamin (B12)
1. Table
2. Unit
mg/kg ww3. Plots
Folate (B9)
1. Table
2. Unit
mg/kg ww3. Plots
Niacin (B3)
1. Table
2. Unit
mg/kg ww3. Plots
Pantothenic acid (B5)
1. Table
2. Unit
mg/kg ww3. Plots
Pyridoxine (B6)
1. Table
2. Unit
mg/kg ww3. Plots
Riboflavin (B2)
1. Table
2. Unit
mg/kg ww3. Plots
Thiamine -HCl (B1)
1. Table
2. Unit
mg/kg ww3. Plots
Vitamin C equivalent (AAE)
1. Table
2. Unit
mg/kg ww3. Plots
Vitamin D3
1. Table
2. Unit
mg/kg ww3. Plots
Vitamin E (alpha-tocopherol)
1. Table
2. Unit
mg/kg ww3. Plots
Vitamin E (beta- tocopherol)
1. Table
2. Unit
mg/kg ww3. Plots
Vitamin E (gamma- tocopherol)
1. Table
2. Unit
mg/kg ww3. Plots
Vitamin E (delta- tocopherol)
1. Table
2. Unit
mg/kg ww3. Plots
Vitamin E (alpha- tocotrienol)
1. Table
2. Unit
mg/kg ww3. Plots
Vitamin E (beta- tocotrienol)
1. Table
2. Unit
mg/kg ww3. Plots
Vitamin E (gamma- tocotrienol)
1. Table
2. Unit
mg/kg ww3. Plots
Vitamin E (delta- tocotrienol)
1. Table
2. Unit
mg/kg ww3. Plots
Vitamin K3 (menadione)
1. Table
2. Unit
mg/kg ww3. Plots
Vitamin K (sum)
1. Table
2. Unit
µg/kg ww3. Plots
Vitamin K1
1. Table
2. Unit
µg/kg ww3. Plots
ß.Y-Dihydro vitamin K1
1. Table
2. Unit
µg/kg ww3. Plots
Vitamin K2 (MK4)
1. Table
2. Unit
µg/kg ww3. Plots
Vitamin K2 (MK5)
1. Table
2. Unit
µg/kg ww3. Plots
Vitamin K2 (MK6)
1. Table
2. Unit
µg/kg ww3. Plots
Vitamin K2 (MK7)
1. Table
2. Unit
µg/kg ww3. Plots
Vitamin K2 (MK8)
1. Table
2. Unit
µg/kg ww3. Plots
Vitamin K2 (MK9)
1. Table
2. Unit
µg/kg ww3. Plots
Vitamin K2 (MK10)
1. Table
2. Unit
µg/kg ww3. Plots
Minerals
Ca
1. Table
2. Unit
mg/kg ww3. Plots
Na
1. Table
2. Unit
mg/kg ww3. Plots
K
1. Table
2. Unit
mg/kg ww3. Plots
Mg
1. Table
2. Unit
mg/kg ww3. Plots
P
1. Table
2. Unit
mg/kg ww3. Plots
Trace elements
Iodine
1. Table
2. Unit
mg/kg ww3. Plots
V
1. Table
2. Unit
mg/kg ww3. Plots
Cr
1. Table
2. Unit
mg/kg ww3. Plots
Mn
1. Table
2. Unit
mg/kg ww3. Plots
Fe
1. Table
2. Unit
mg/kg ww3. Plots
Co
1. Table
2. Unit
mg/kg ww3. Plots
Ni
1. Table
2. Unit
mg/kg ww3. Plots
Cu
1. Table
2. Unit
mg/kg ww3. Plots
Zn
1. Table
2. Unit
mg/kg ww3. Plots
As
1. Table
2. Unit
mg/kg ww3. Plots
Se
1. Table
2. Unit
mg/kg ww3. Plots
Mo
1. Table
2. Unit
mg/kg ww3. Plots
Ag
1. Table
2. Unit
mg/kg ww3. Plots
Cd
1. Table
2. Unit
mg/kg ww3. Plots
Hg
1. Table
2. Unit
mg/kg ww3. Plots
Pb
1. Table
2. Unit
mg/kg ww3. Plots