General stats (weights)
General statistics of weight data
About this page
Statistical analysis
In addition to general descriptive statistics, the page also exhibits the results from the following two ANOVA analyses.
Statistical analysis on the phase 1 + spawning samples
Statistical analysis on the phase 2 samples
Page contents
This page is organized into multiple sections with each section being dedicated to a single tissue. A section contains six sub-sections, and here’s an overview of what you’ll find in each section:
Number of samples: A table displays the sample counts for various months.
Descriptive statistics by tissue and month: A table presents basic statistics (mean, SD, min, and max) of samples grouped by month. “# NA” indicates the count of samples without valid values.
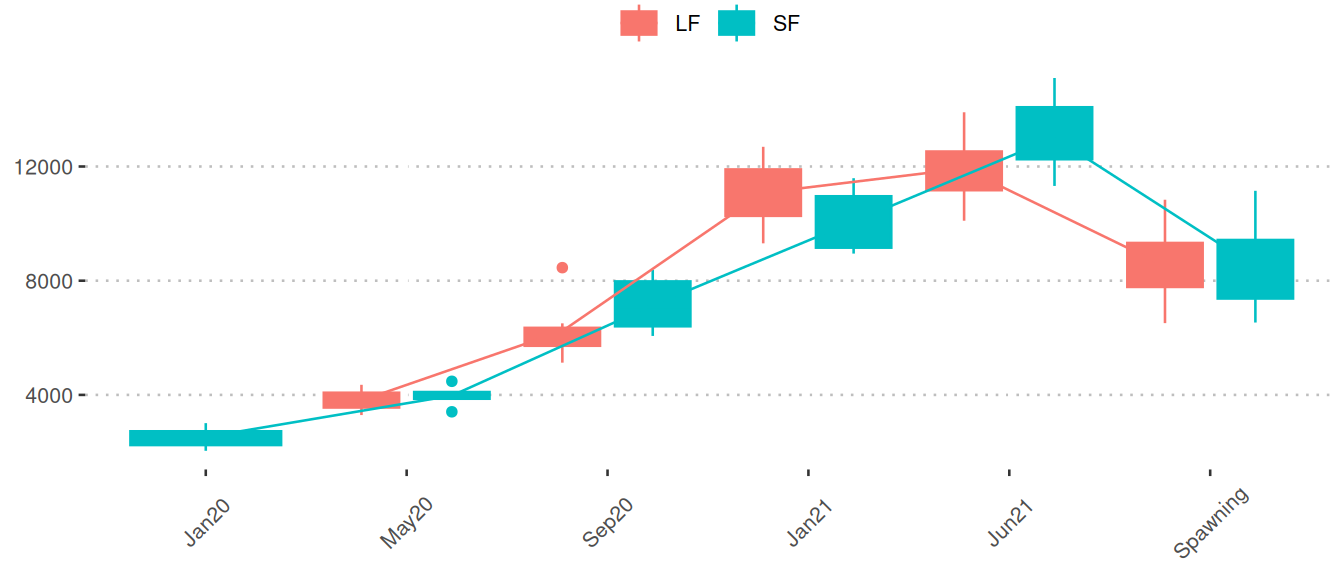
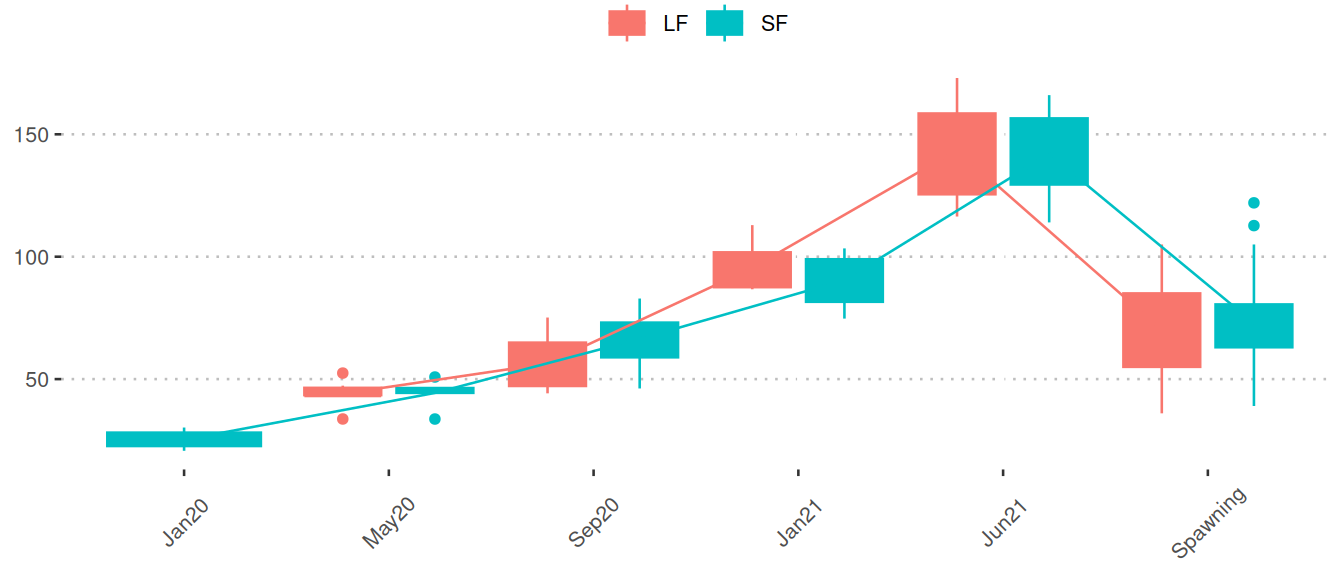
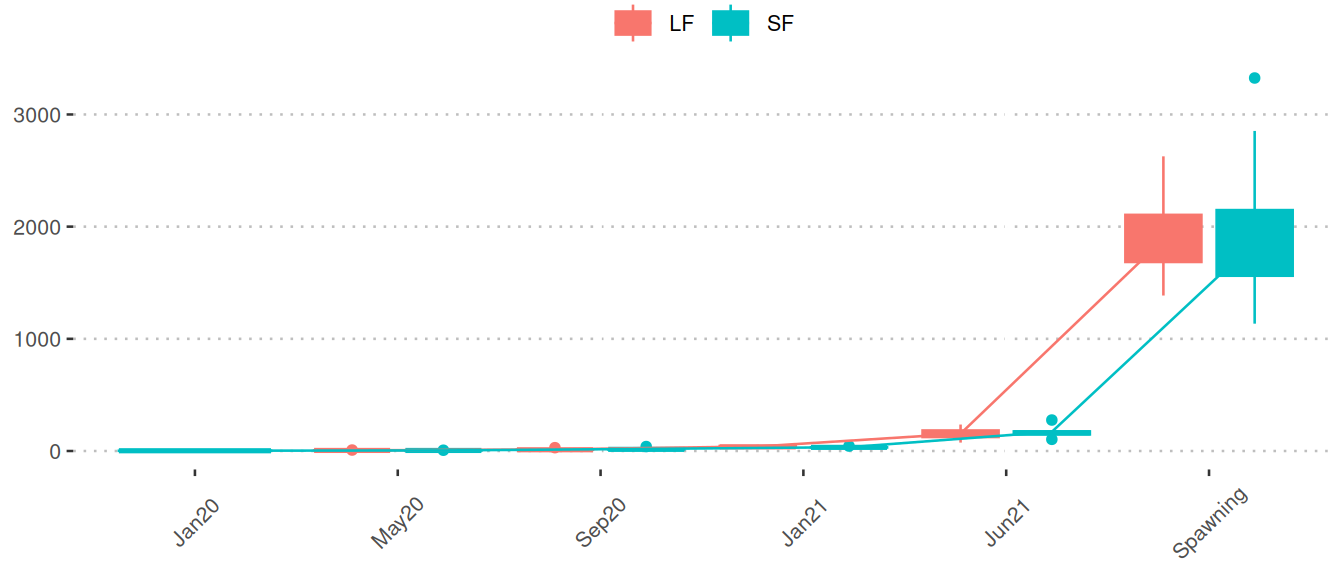
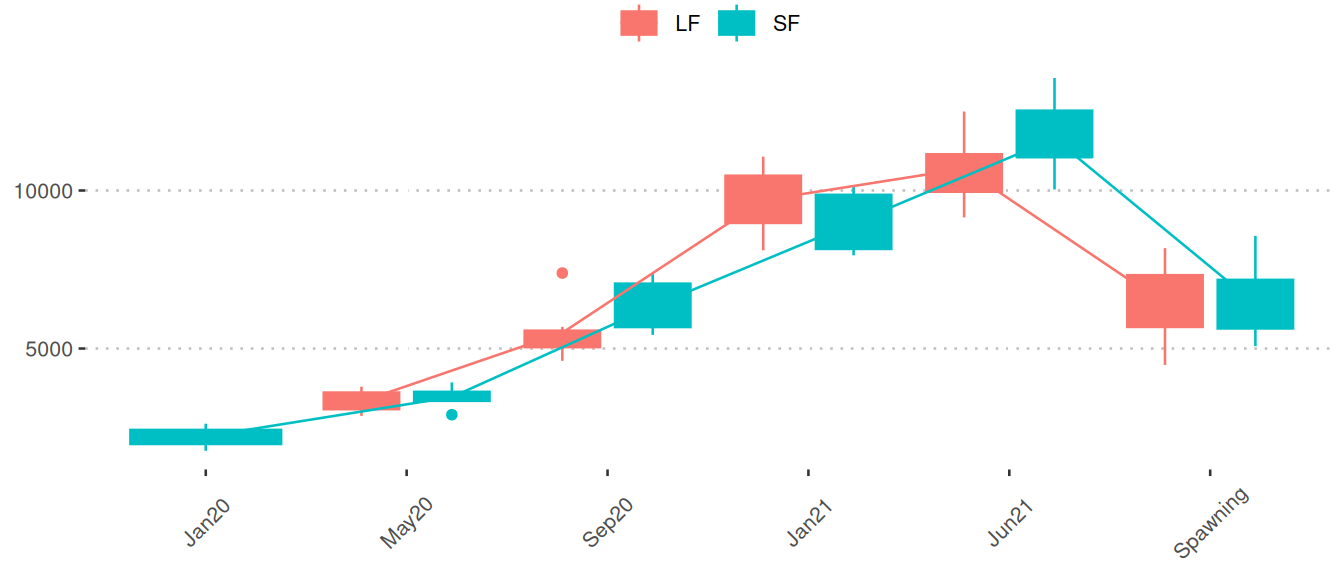
Boxplots of the phase 1 samples (broodstock): Boxplots depict nutrient/metabolite levels separated by LF (red) and SF (blue) among six sampling points. Mean values of months are connected by lines. The five sampling points from broodstock are:
- Jan20: January 2020
- May20: May 2020
- Sep20: September 2020
- Jan21: January 2021
- Jun21: June 2021
Spawning samples consist of three sampling points:
- Nov21: November 2021 (early)
- Dec21: December 2021 (normal)
- Feb22: February 2022 (late)
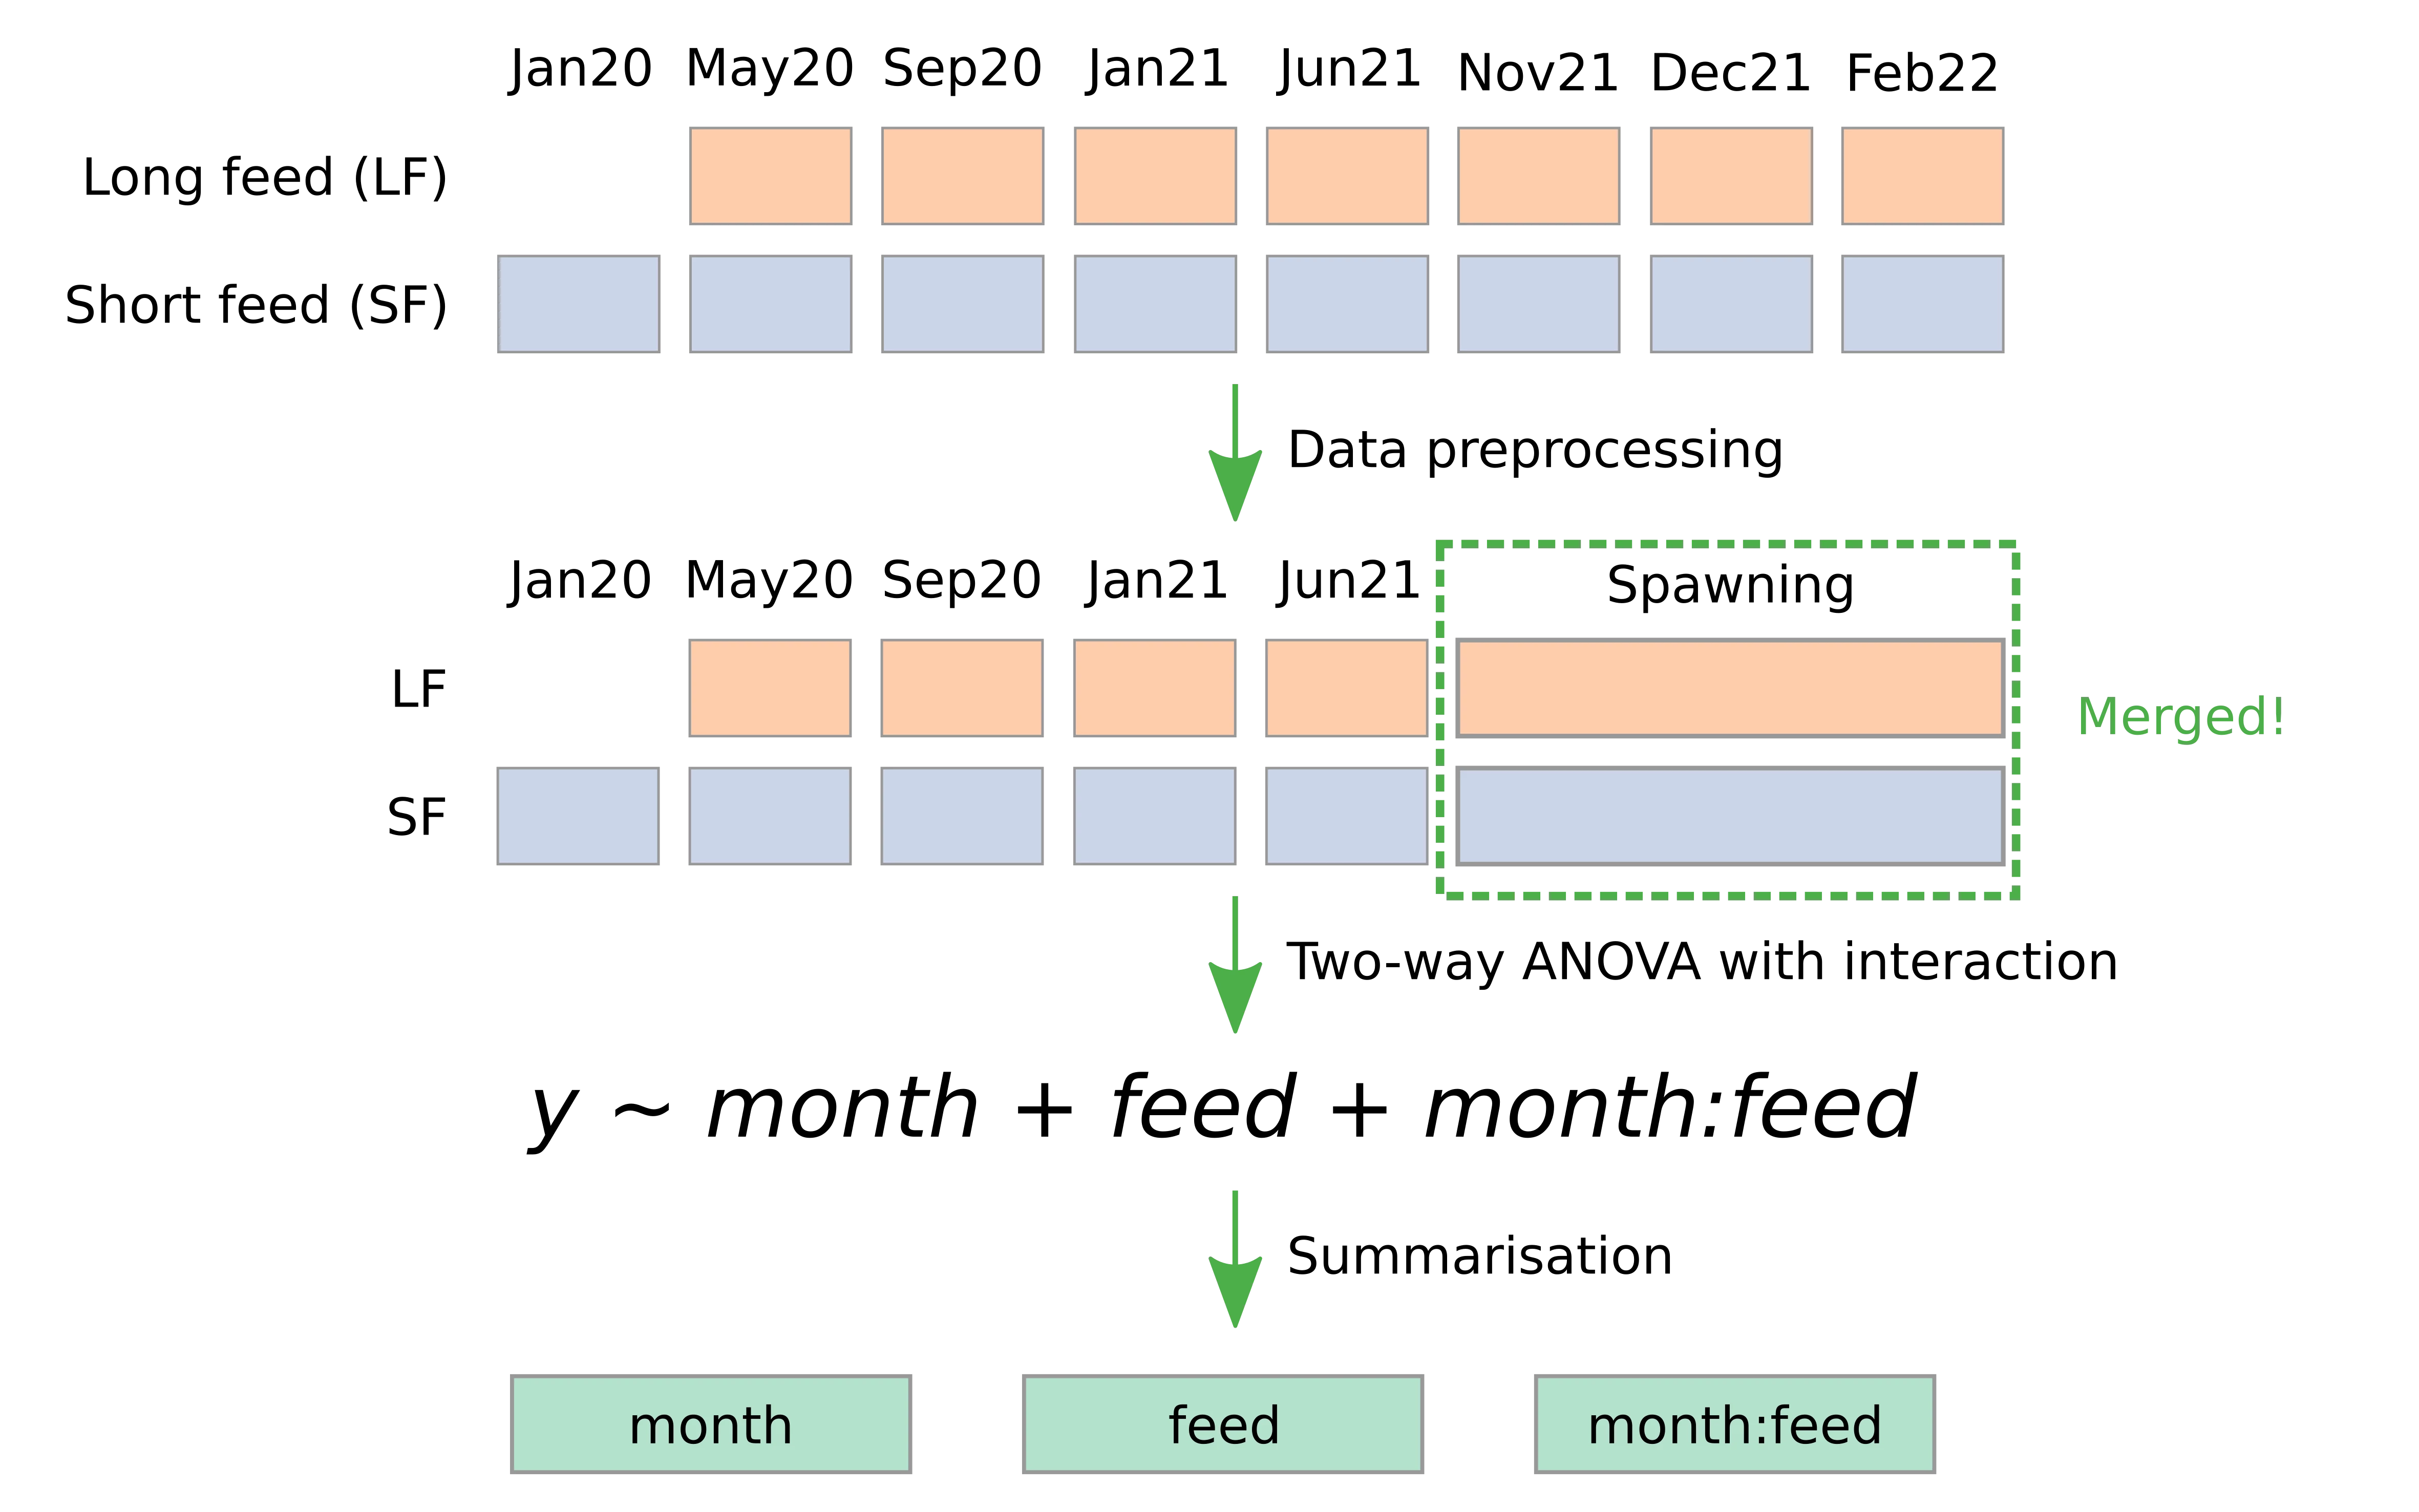
Two-way ANOVA using the phase 1 + spawning samples: A table displays the results of a two-way ANOVA performed by:
- Dependent variable: value (weight)
- Independent variables: month, feed, month:feed interaction.
Note
Jan20 only has SF (blue) samples; ANOVA treats the three sampling points of spawning/offspring as one group.
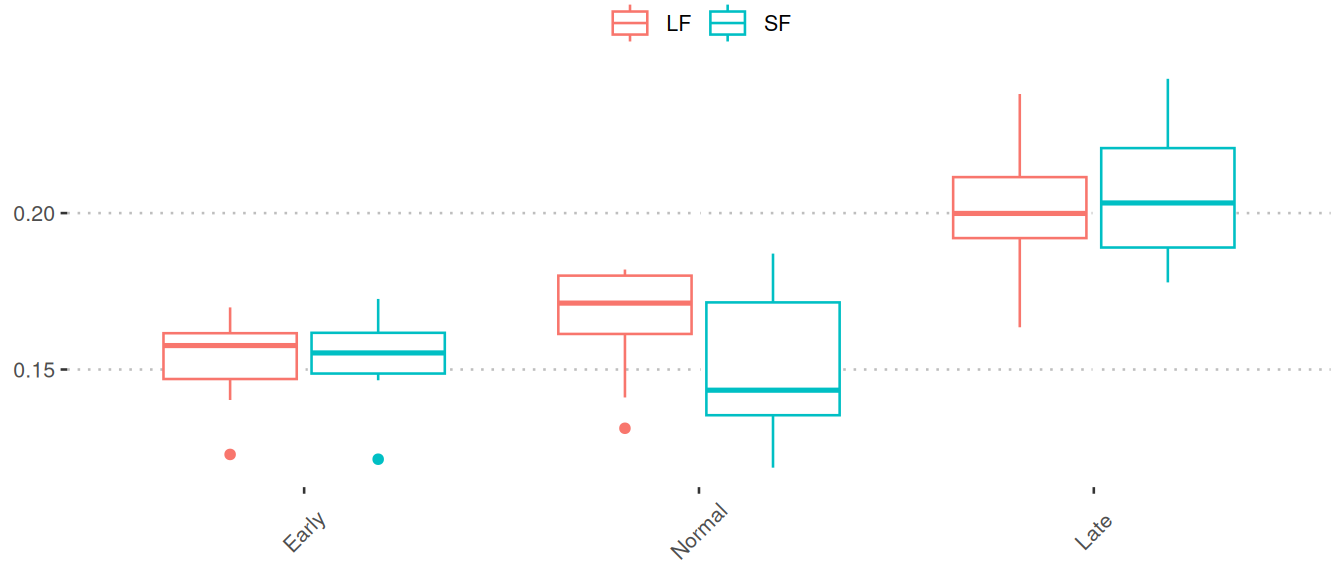
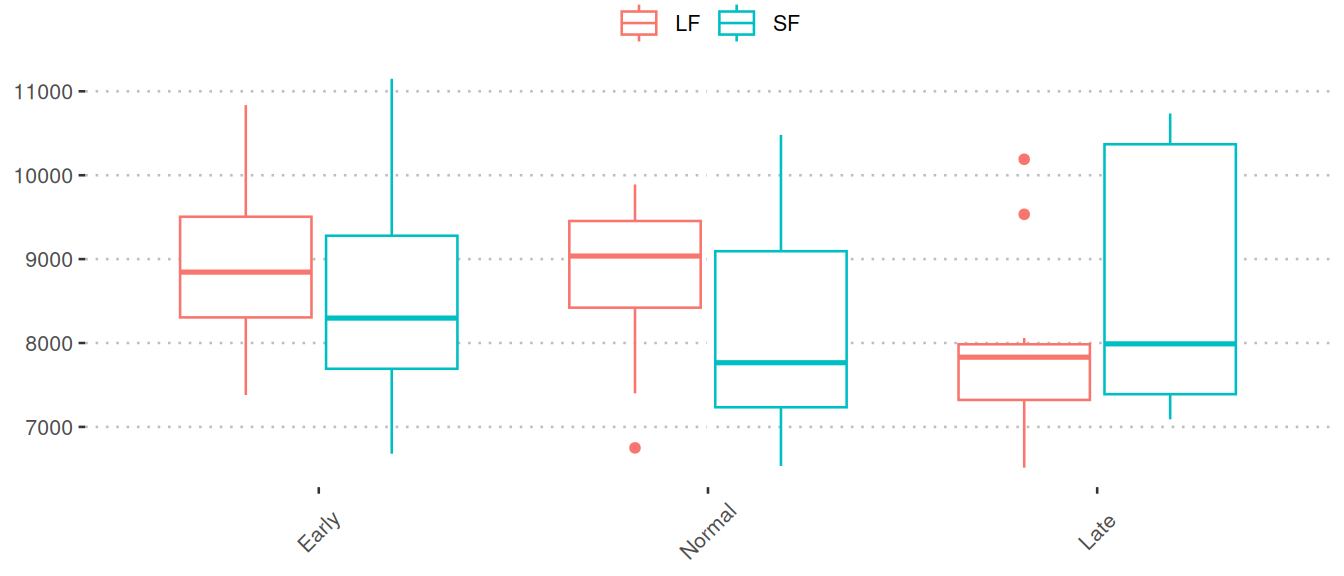
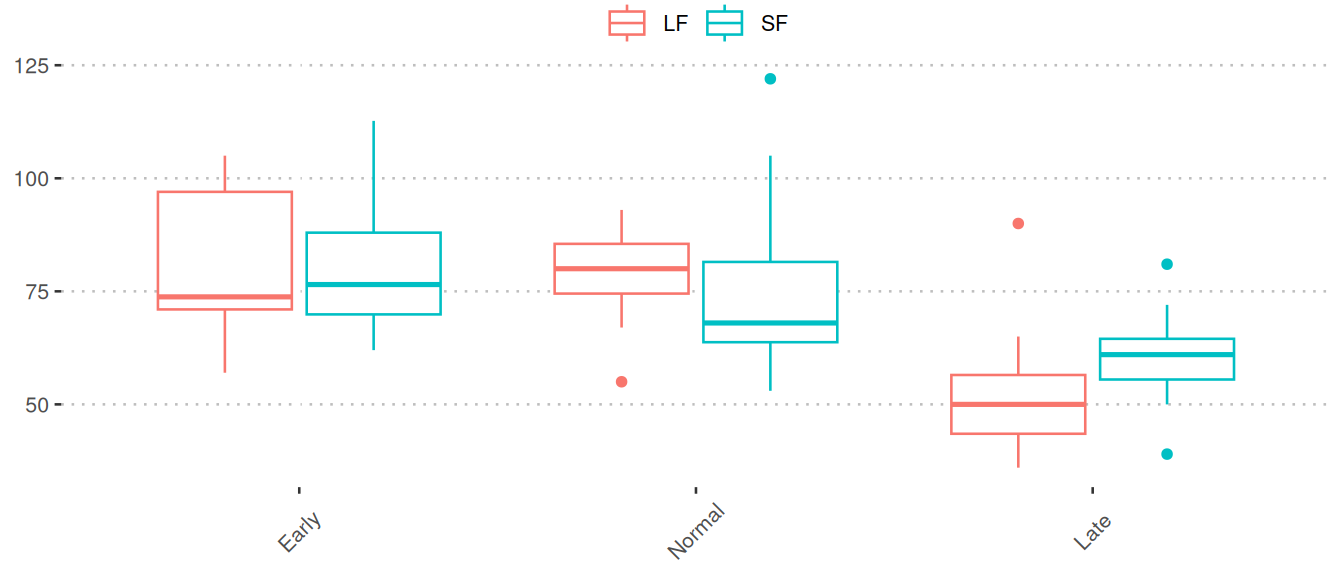
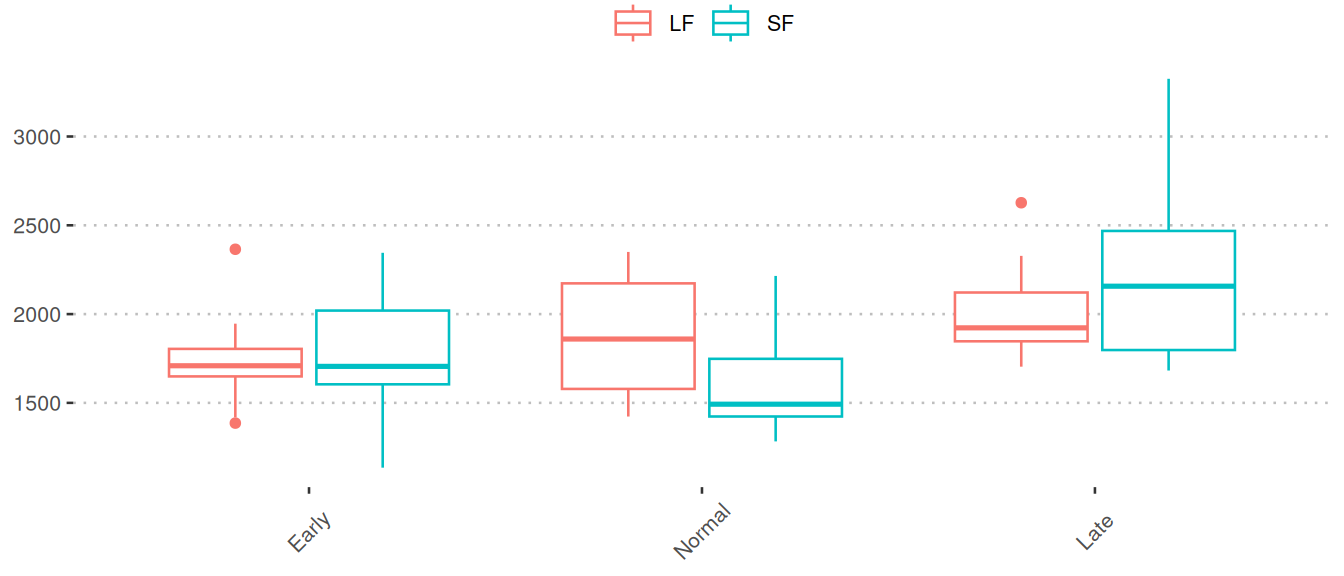
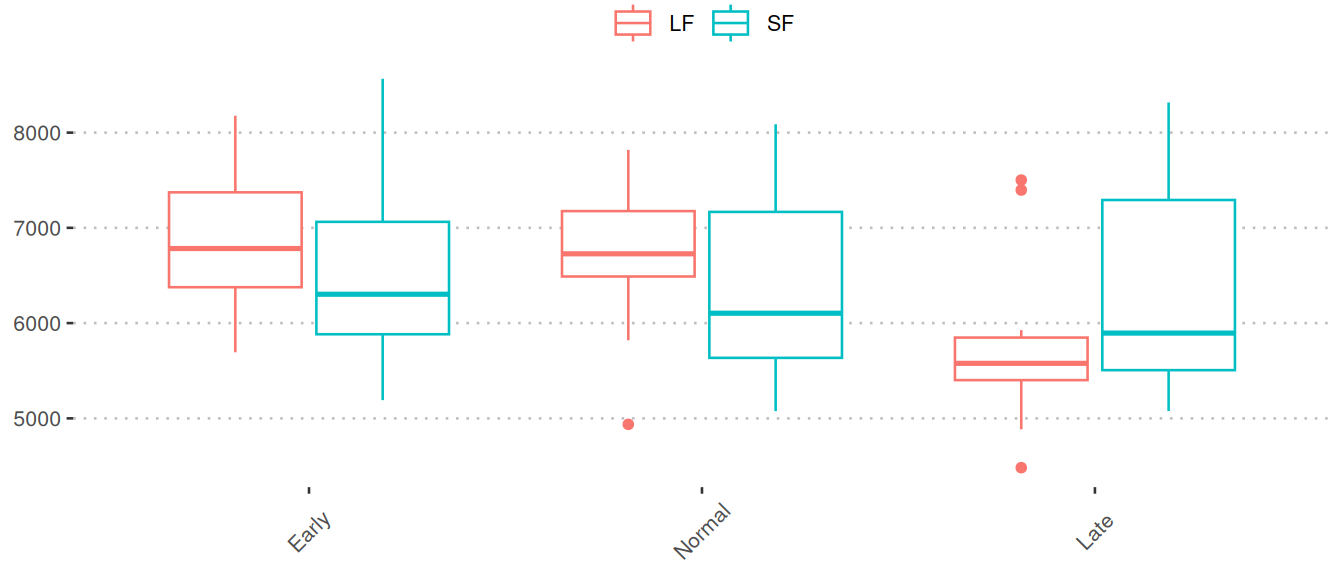
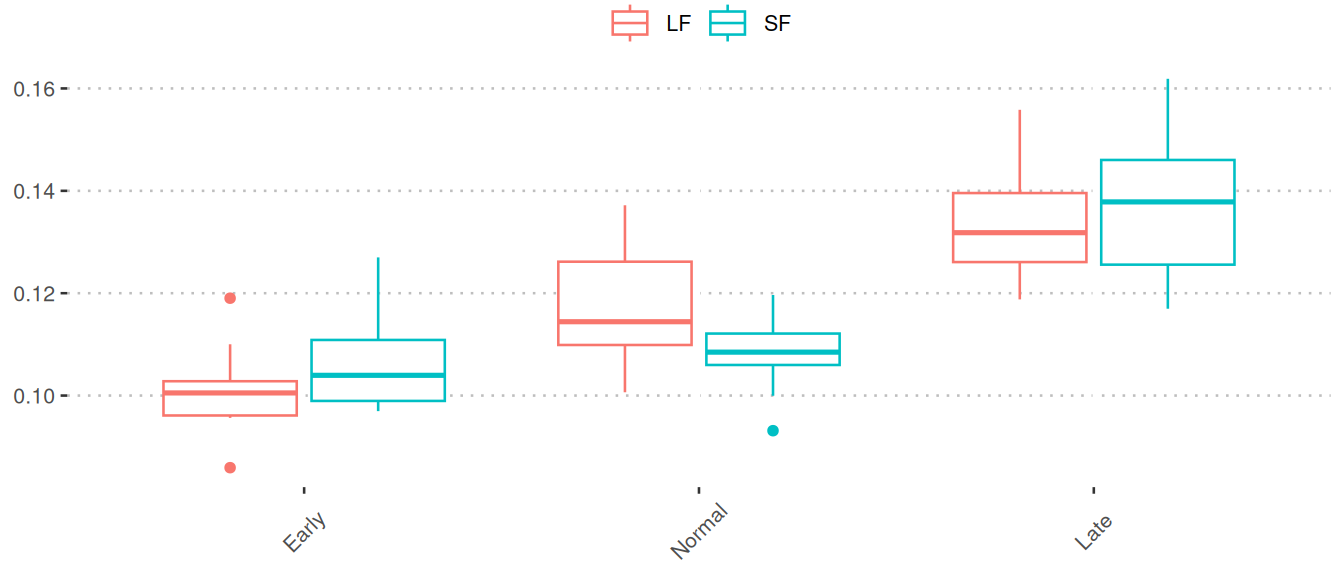
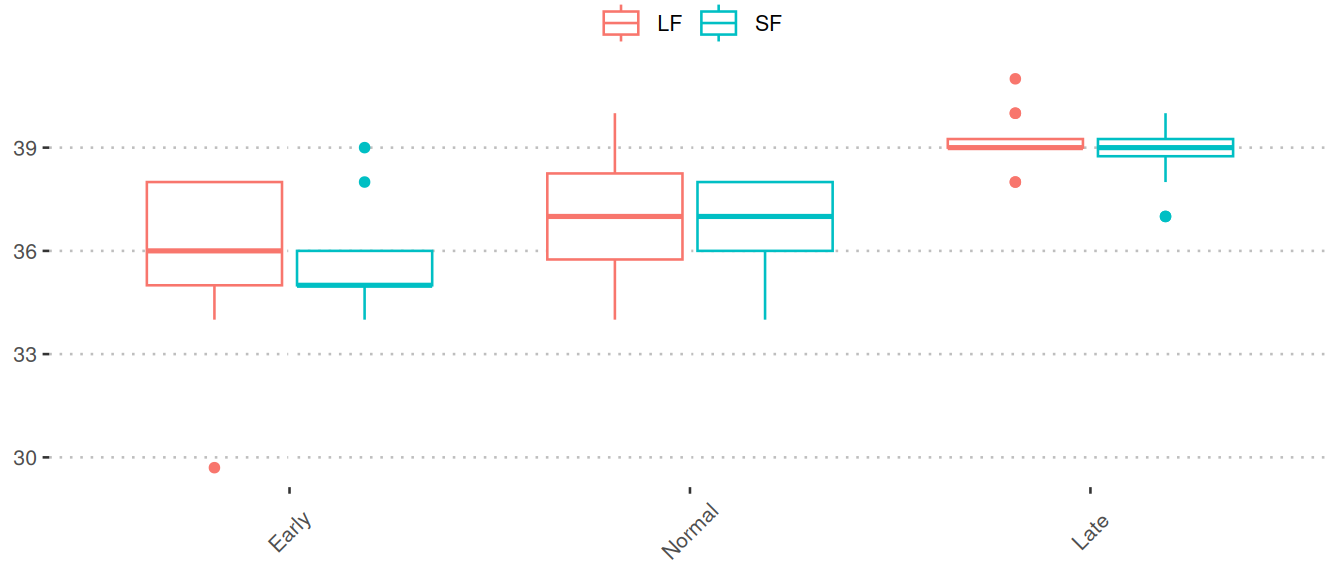
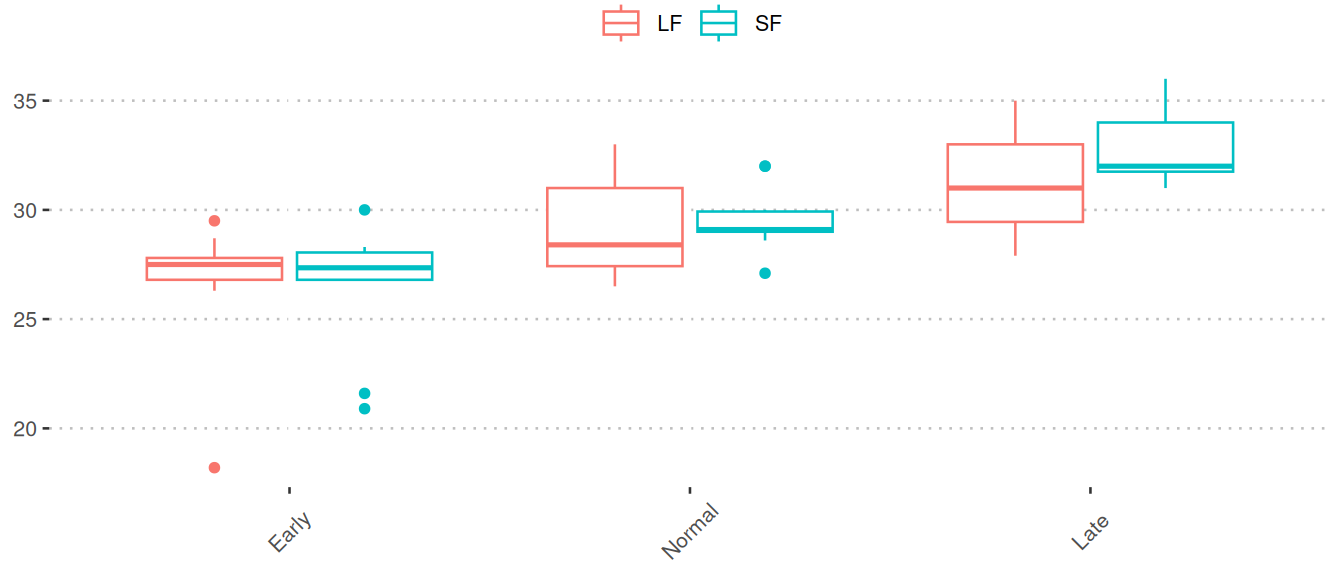
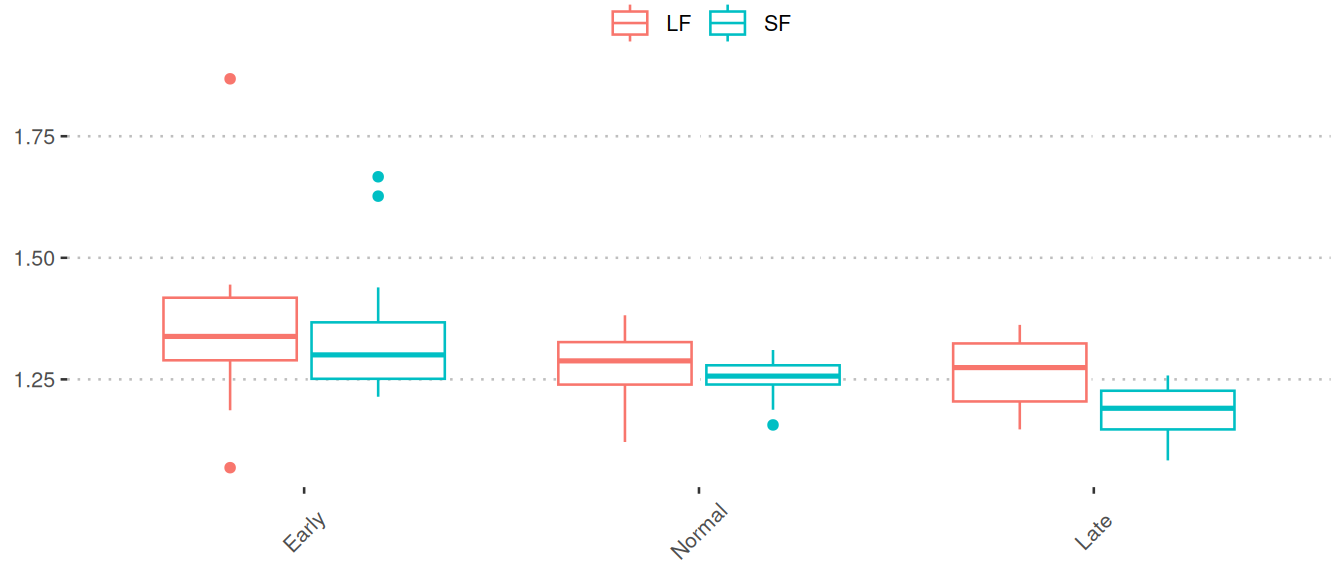
Boxplots of the phase 2 samples (spawning/offspring): Boxplots show measured weights separated by LF (red) and SF (blue) among the three final sampling points. Mean values of months are connected by lines. The final sampling points are categorized as:
- Early: November 2021 (Nov21)
- Normal: December 2021 (Dec21)
- Late: February 2022 (Feb22)
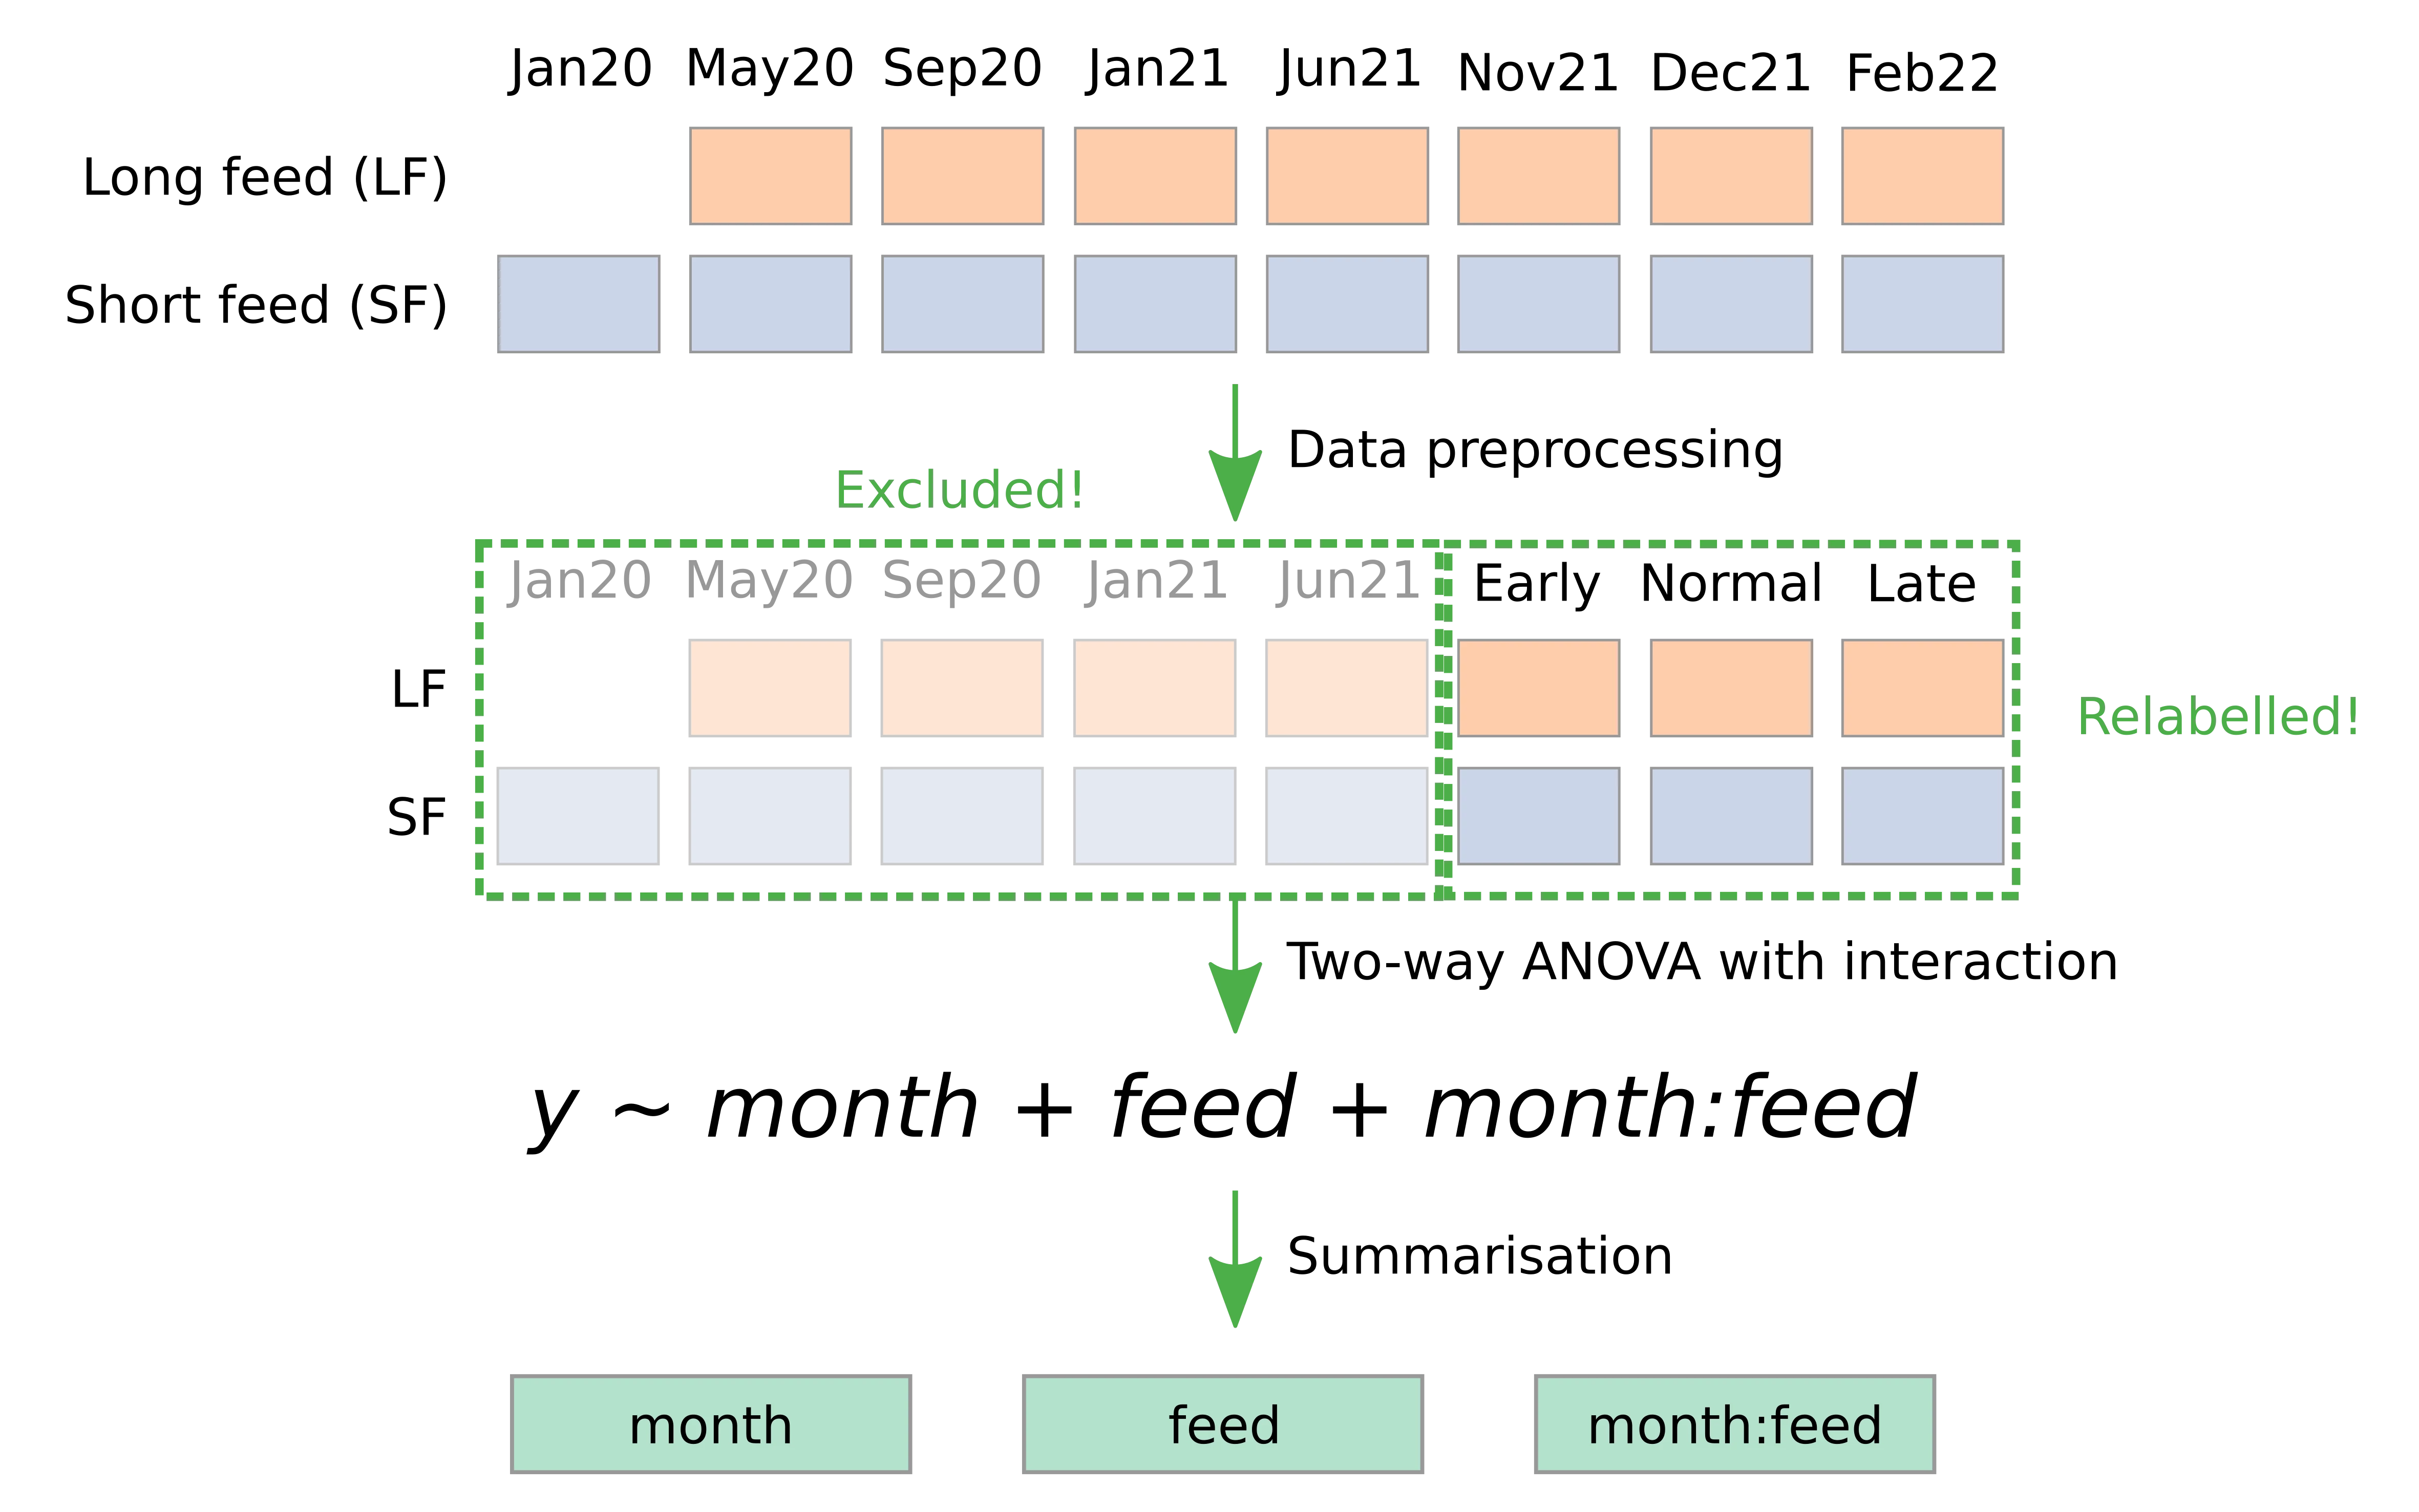
Two-way ANOVA using the phase 2 samples (spawning/offspring): A table presents the results of a two-way ANOVA performed by:
- Dependent variable: value (weight)
- Independent variables: month, feed, month:feed interaction.
ANOVA is performed exclusively on the three sampling points of spawning/offspring.
Tissue
Whole body
1. Number of samples
2. Descriptive statistics by month
3. Boxplots of the phase 1 + spawning samples
4. Two-way ANOVA using the phase 1 + spawning samples
5. Boxplots of the phase 2 samples (spawning/offspring)
6. Two-way ANOVA using the phase 2 samples (spawning/offspring)
Liver
1. Number of samples
2. Descriptive statistics by month
3. Boxplots of the phase 1 + spawning samples
4. Two-way ANOVA using the phase 1 + spawning samples
5. Boxplots of the phase 2 samples (spawning/offspring)
6. Two-way ANOVA using the phase 2 samples (spawning/offspring)
Gonad
1. Number of samples
2. Descriptive statistics by month
3. Boxplots of the phase 1 + spawning samples
4. Two-way ANOVA using the phase 1 + spawning samples
5. Boxplots of the phase 2 samples (spawning/offspring)
6. Two-way ANOVA using the phase 2 samples (spawning/offspring)
Muscle
1. Number of samples
2. Descriptive statistics by month
3. Boxplots of the phase 1 + spawning samples
4. Two-way ANOVA using the phase 1 + spawning samples
5. Boxplots of the phase 2 samples (spawning/offspring)
6. Two-way ANOVA using the phase 2 samples (spawning/offspring)
Egg
Egg (wet)
1. Number of samples
2. Descriptive statistics by month
3. Boxplots of the phase 1 + spawning samples
[1] "No data"4. Two-way ANOVA using the phase 1 + spawning samples
[1] "No data"5. Boxplots of the phase 2 samples (spawning/offspring)
6. Two-way ANOVA using the phase 2 samples (spawning/offspring)
Unfertilised egg (dry)
1. Number of samples
2. Descriptive statistics by month
3. Boxplots of the phase 1 + spawning samples
[1] "No data"4. Two-way ANOVA using the phase 1 + spawning samples
[1] "No data"5. Boxplots of the phase 2 samples (spawning/offspring)
6. Two-way ANOVA using the phase 2 samples (spawning/offspring)
Fertilised egg (dry)
1. Number of samples
2. Descriptive statistics by month
3. Boxplots of the phase 1 + spawning samples
[1] "No data"4. Two-way ANOVA using the phase 1 + spawning samples
[1] "No data"5. Boxplots of the phase 2 samples (spawning/offspring)
6. Two-way ANOVA using the phase 2 samples (spawning/offspring)
Swelling
1. Number of samples
2. Descriptive statistics by month
3. Boxplots of the phase 1 + spawning samples
[1] "No data"4. Two-way ANOVA using the phase 1 + spawning samples
[1] "No data"5. Boxplots of the phase 2 samples (spawning/offspring)
6. Two-way ANOVA using the phase 2 samples (spawning/offspring)
Offspring
Alevin
1. Number of samples
2. Descriptive statistics by month
3. Boxplots of the phase 1 + spawning samples
[1] "No data"4. Two-way ANOVA using the phase 1 + spawning samples
[1] "No data"5. Boxplots of the phase 2 samples (spawning/offspring)