Comparison by months (broodstock, VD, VE & VK)
Comparative analysis of vitamin D, E, and K levels in broodstock samples based on months
About this page
This page presents the findings from our analysis of broodstock samples during the saltwater period, focusing on five sampling points.
Statistical analysis
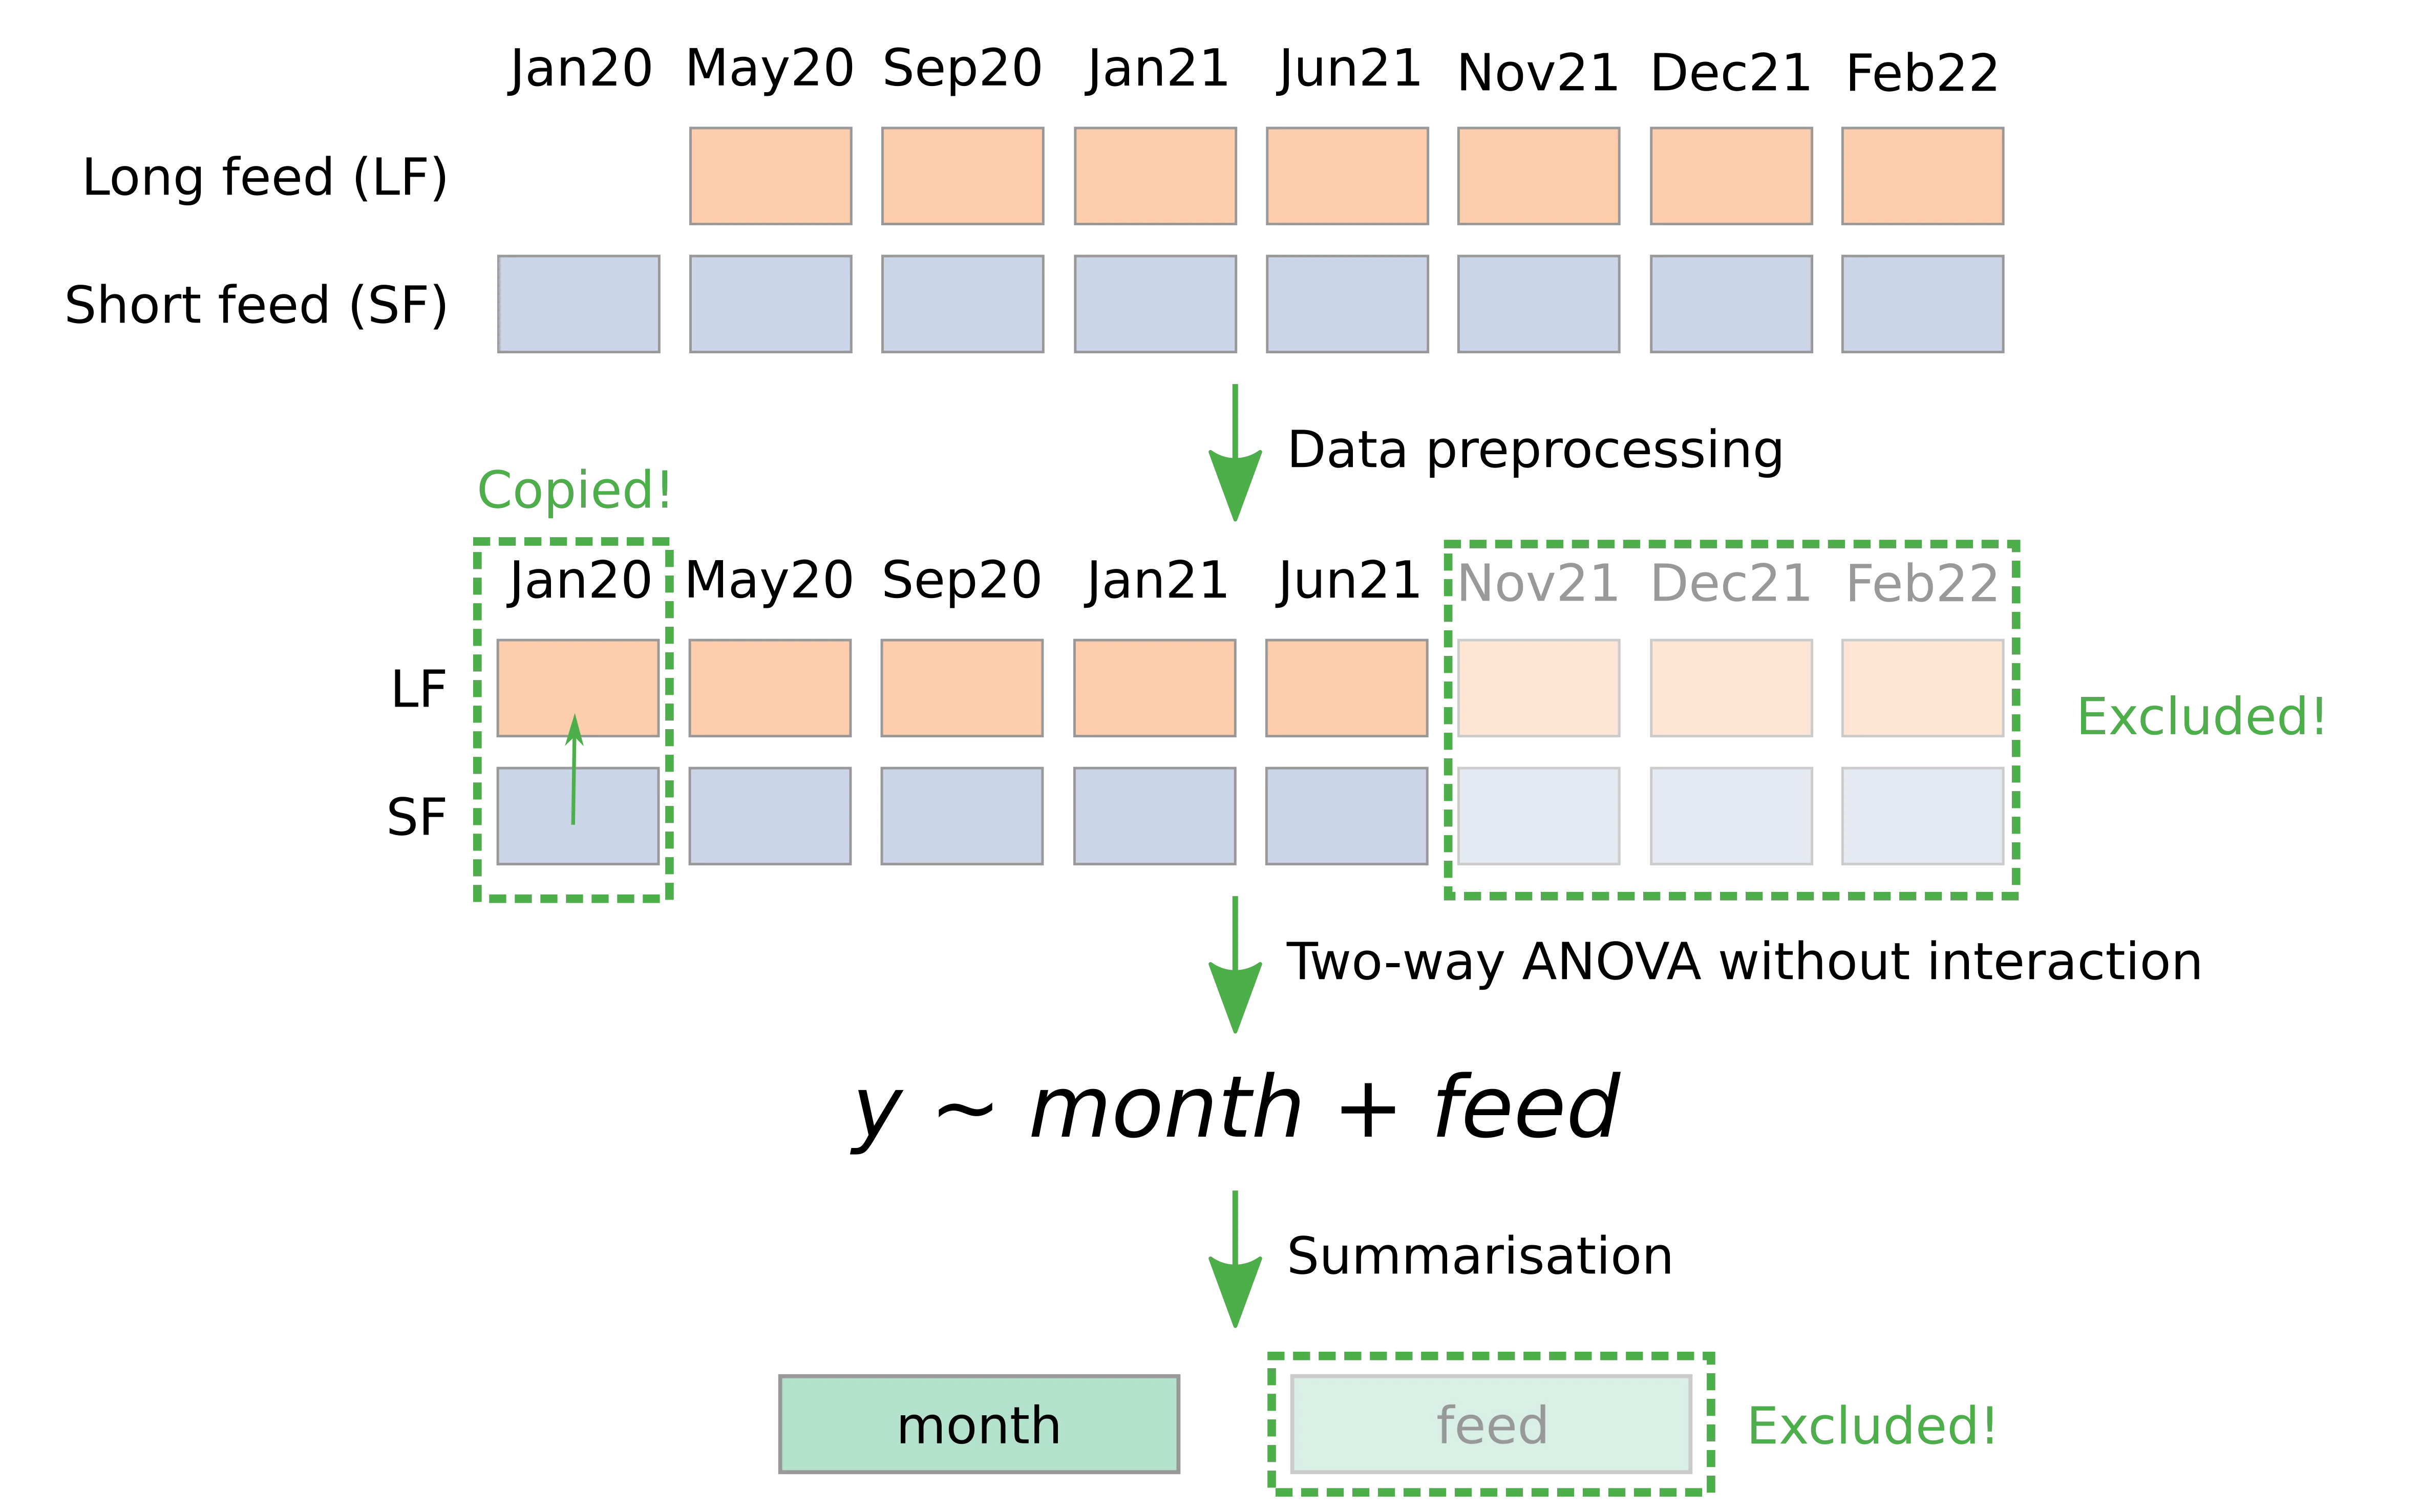
Two-way ANOVA was performed for each nutrient/metabolite by:
- Dependent variable: level of nutrient/metabolite.
- Independent variables: month and feed.
Only p-values calculated from the “month” factor were used in this analysis. The significance level is represented throughout the page as follows:
- NS: non-significance
- *: significant (p-value < 0.05)
- **: highly significant (p-value < 0.01)
- ***: very highly significant (p-value < 0.001)
Note
For the month “Jan20,” we only have SF samples. In this case, LF samples were copied from SF samples before ANOVA. Therefore, SF and LF samples are identical for Jan20.
Page sections
This page is organized with three sub-sections.
Summary table: A table displays the sample counts of ANOVA results categorized into four significance levels: NS, *,**, and ***.
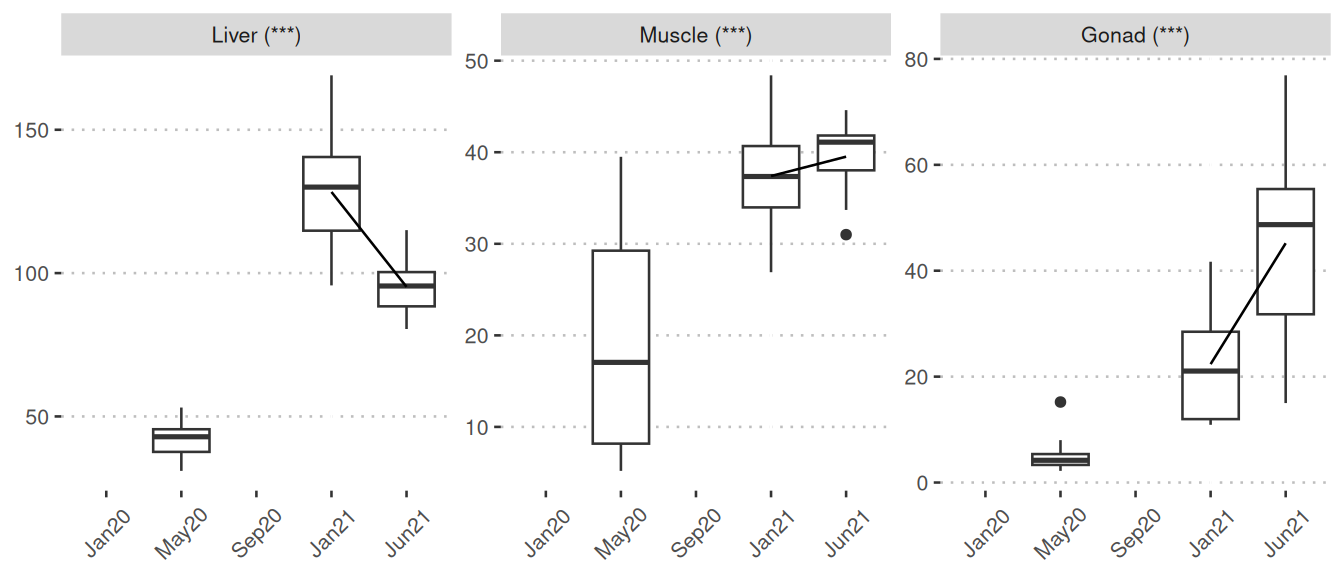
Significant: The boxplots visually represent nutrient/metabolite levels across five sampling points. These boxplots are only displayed when at least one comparison is identified as significant. The boxplots connect mean values of months through lines. The five sampling points are:
- Jan20: January 2020
- May20: May 2020
- Sep20: September 2020
- Jan21: January 2021
- Jun21: June 2021
Significance levels are indicated next to the tissue name within parentheses at the top of each boxplot.
Non-significant: This section displays boxplots for the nutrients/metabolites that did not yield any significant outcomes. Essentially, the format is the same as that of the Significant section.
Summary table
Significant (4/4)
Vitamin D3
Vitamin D3
Unit: mg/kg ww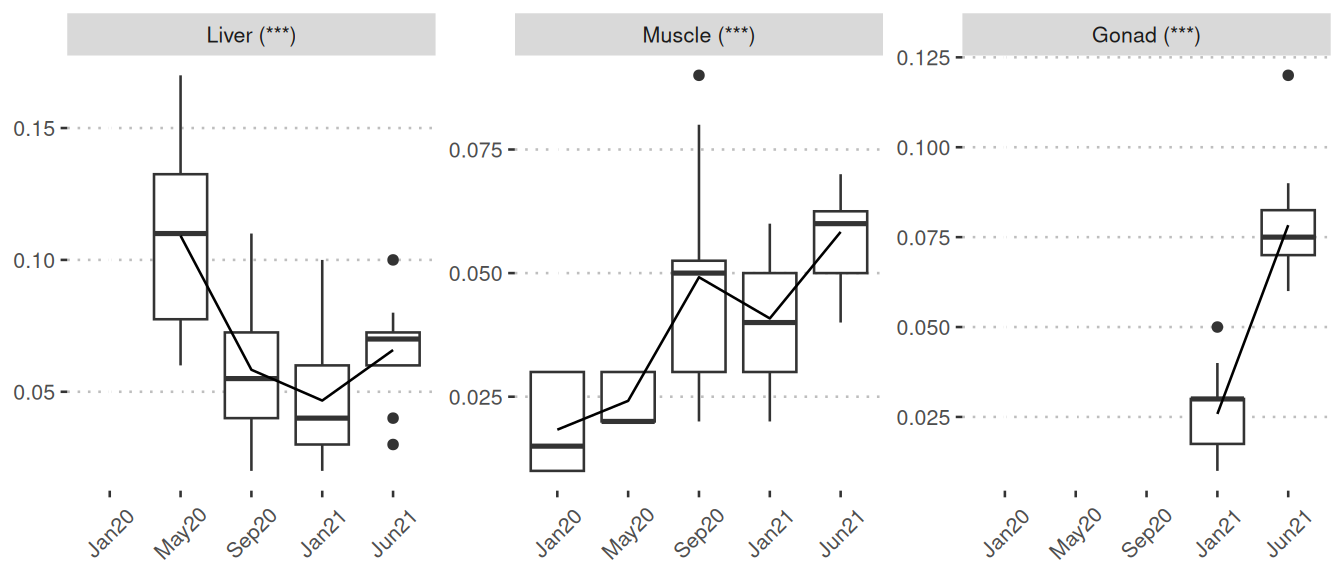
Vitamin E
Vitamin E
Unit: mg/kg ww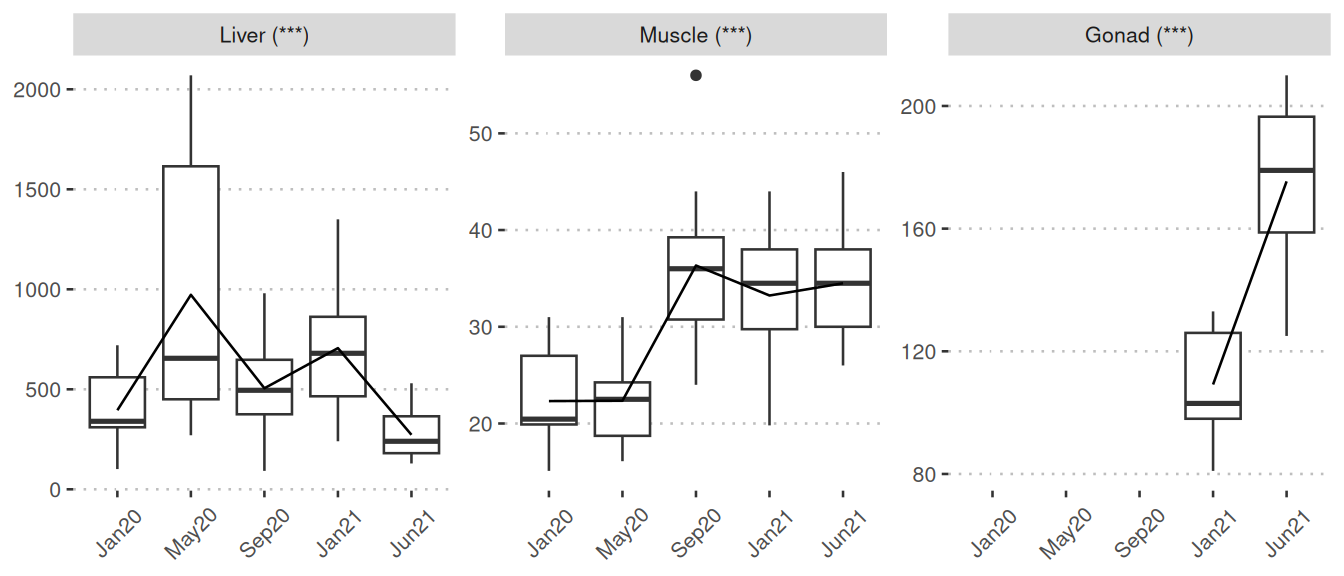
Vitramin K
Vitamin K1
Unit: µg/kg ww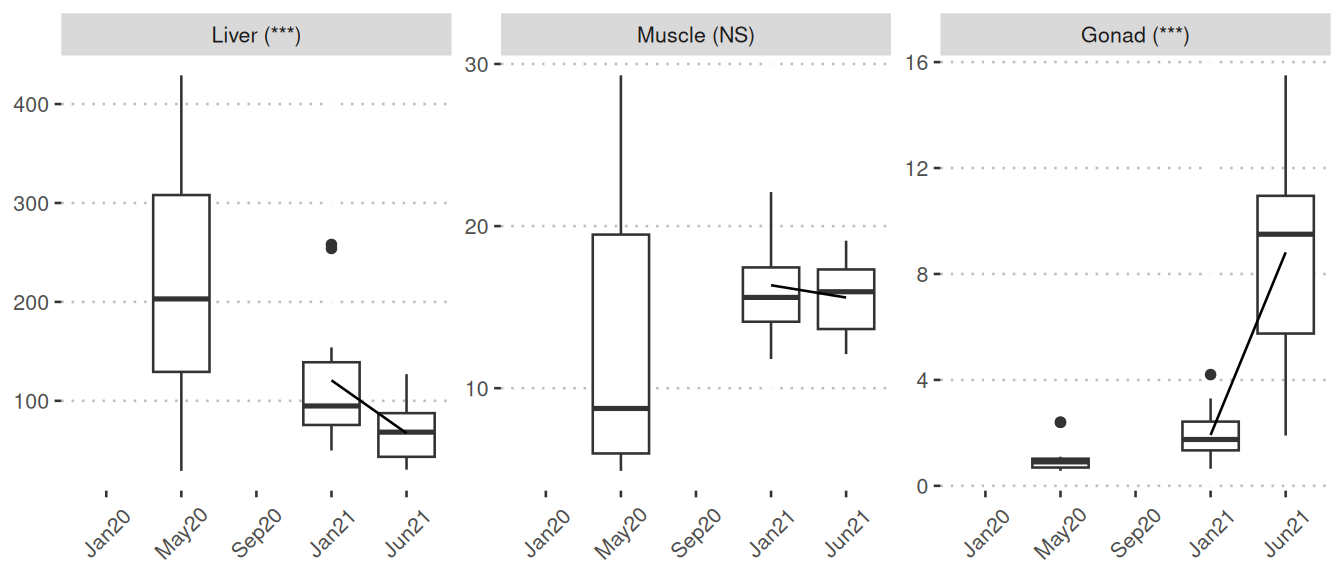
Vitamin K2
Unit: µg/kg ww